In this tutorial, you will learn how to monitor SSL/TLS certificate expiry with Prometheus and Grafana. Well, with the assumption that you are already aware about the implications of an expired SSL/TLS certificate, we will be discussing how to monitor SSL/TLS certificates to avoid encountering such issues.
Monitoring SSL/TLS Certificate Expiry with Prometheus and Grafana
Note that, in this setup, we are using a single node hosting Telegraf (to poll certificate stats), Prometheus and Grafana.
Install and setup Grafana
You can use any of the guides below or any other guide to install and setup Grafana;
Install latest Grafana on Debian 10
Install Latest Grafana on CentOS 8
Install and Setup Prometheus Server
Similarly, you can use any of the guides below or any other guide to install and setup Prometheus
Install and Setup Prometheus on Ubuntu 20.04
Install and Configure Prometheus on CentOS 8
Install Prometheus on Debian 10
Install and setup Telegraf
Telegraf is a plugin-driven server agent that is used for collecting and sending metrics and events from databases, systems, and IoT sensors.
Telegraf through its x509_cert plugin, which provides statistics about X509 certificate accessible via local file or network connection. Such statistics can be sent to Prometheus where then, can be visualized using Grafana.
Before you can install Telegraf, ensure that the time is correctly set. Telegraf uses a host’s local time in UTC to assign timestamps to data. Use the Network Time Protocol (NTP) to synchronize time between hosts; if hosts’ clocks aren’t synchronized with NTP, the timestamps on the data can be inaccurate.
In our setup, we are using a Debian system, hence you can install Telegraf as follows;
wget -qO- https://repos.influxdata.com/influxdb.key | sudo apt-key add -echo "deb https://repos.influxdata.com/debian buster stable" | sudo tee /etc/apt/sources.list.d/influxdb.listapt updateapt install telegrafConfiguring Telegraf
Once Telegraf is installed and running, configure it to enable Prometheus to scrape metrics from it;
vim# # Configuration for the Prometheus client to spawn
[[outputs.prometheus_client]]
# ## Address to listen on
listen = "192.168.59.12:9273"
metric_version = 2Next, configure Telegraf to poll SSL certificate metrics, either local file or from network connection.
# # Reads metrics from a SSL certificate
 [[inputs.x509_cert]]
#   ## List certificate sources
#   sources = ["/etc/ssl/certs/ssl-cert-snakeoil.pem", "tcp://example.org:443"]
   sources = ["https://kifarunix-demo.com:443"]
   insecure_skip_verify = true
You can disable the default input plugins: cpu, disk, diskio, kernel, mem, processes, swap and system by commenting them.
Save and exit the configuration file.
The x509 certificate input plugin metrics include;
- x509_cert
- tags:
- source – source of the certificate
- organization
- organizational_unit
- country
- province
- locality
- verification
- serial_number
- signature_algorithm
- public_key_algorithm
- issuer_common_name
- issuer_serial_number
- san
- fields:
- verification_code (int)
- verification_error (string)
- expiry (int, seconds)
- age (int, seconds)
- startdate (int, seconds)
- enddate (int, seconds)
- tags:
Restart Telegraf;
systemctl restart telegrafAdd Telegraf Target to Prometheus
For Prometheus to be able to scrape the SSL certificate metrics collected by the Telegraf, open the prometheus.yml configuration and add the target like;
  - job_name: 'SSL/TLS Certs'
    static_configs:
    - targets: ['192.168.59.12:9273']
See my configuration file below.
vim /etc/prometheus/prometheus.yml# A scrape configuration containing exactly one endpoint to scrape:
# Here it's Prometheus itself.
scrape_configs:
# The job name is added as a label `job=<job_name>` to any timeseries scraped from this config.
- job_name: 'prometheus'
# metrics_path defaults to '/metrics'
# scheme defaults to 'http'.
static_configs:
- targets: ['localhost:9090']
- job_name: 'SSL/TLS Certs'
static_configs:
- targets: ['192.168.59.12:9273']Save and exit the file;
Restart Prometheus;
systemctl restart prometheusVerify the status of Prometheus Target
You can check status of the Prometheus telegraf target;

Also, check the Prometheus queries for x509* metrics.

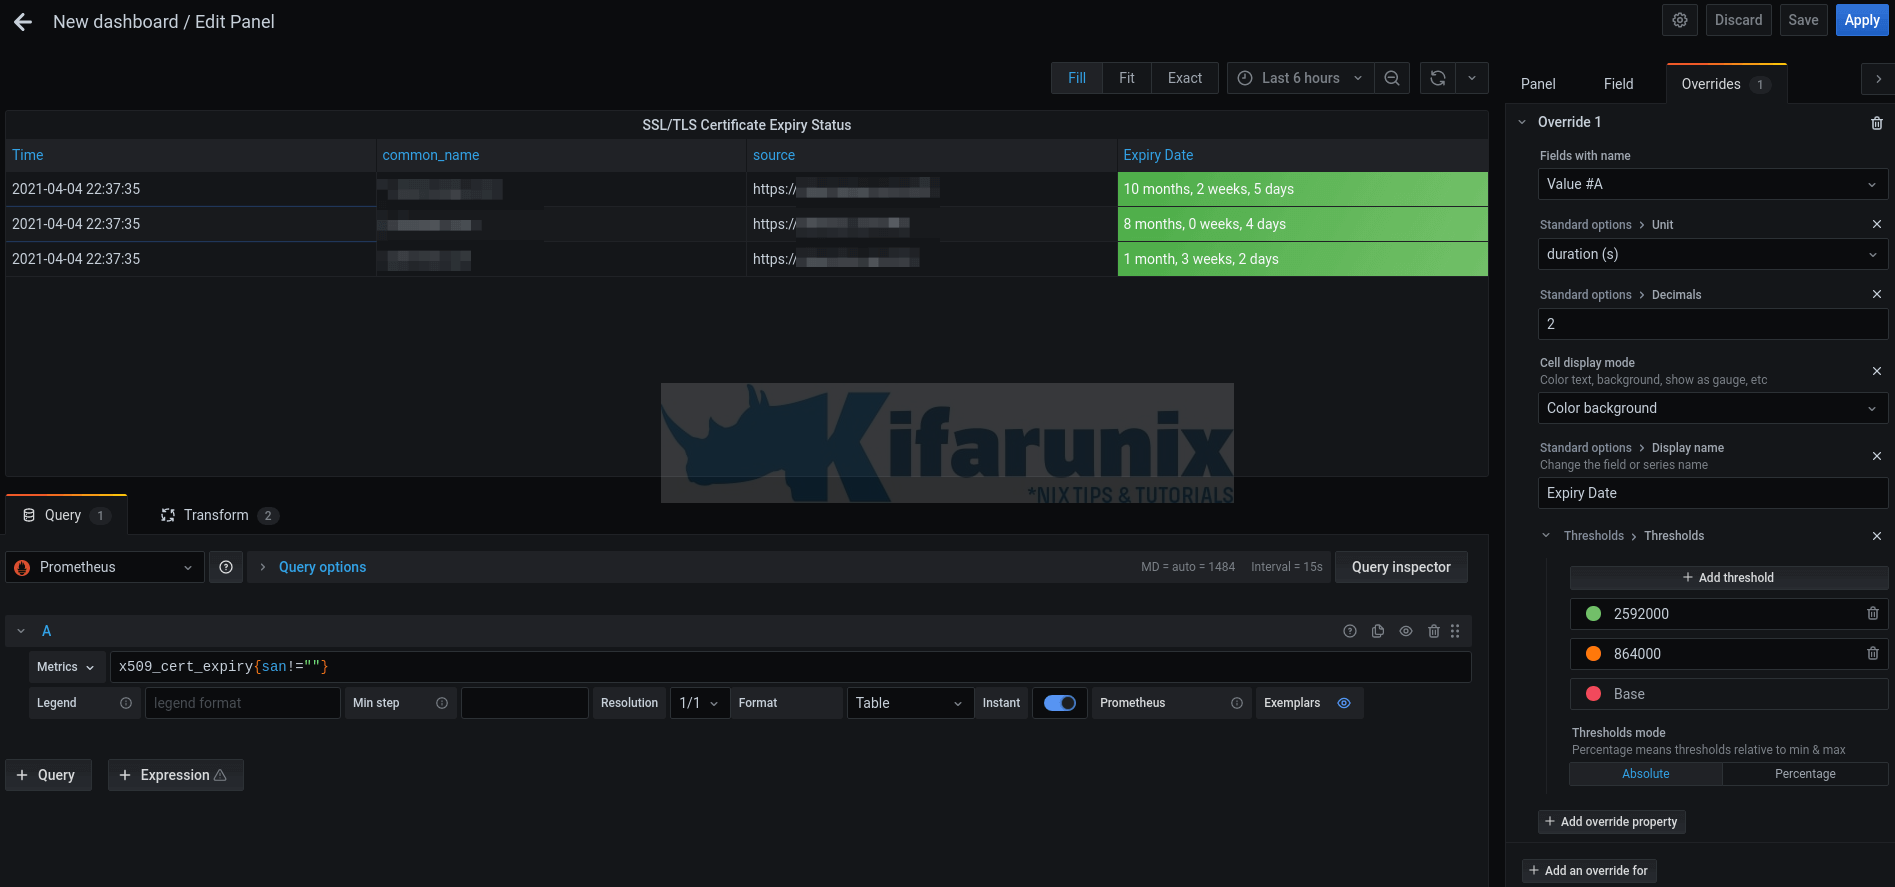
Running the x509_cert_expiry query and filtering out some metrics. This is the expiry query we used, x509_cert_expiry{san!=""}, which filters out any metric that do not contain san value.

Integrate Prometheus with Grafana For Monitoring
You can now integrate Prometheus with Grafana by adding Prometheus data source to Grafana. Check the link below;
Integrate Prometheus with Grafana For Monitoring
Data sources, once you have added the Prometheus data source.

Using Prometheus and Grafana to Monitor SSL/TLS Certificate Expiry
Once you have integrated Prometheus with Grafana, you can now proceed to configure Prometheus to poll your servers certificate metrics and sent them to Grafana for visualization.
Create SSL Certificate Expiry Dashboard.
On the left menu panel, click the + (plus sign) > Dashboard > Add an empty panel.
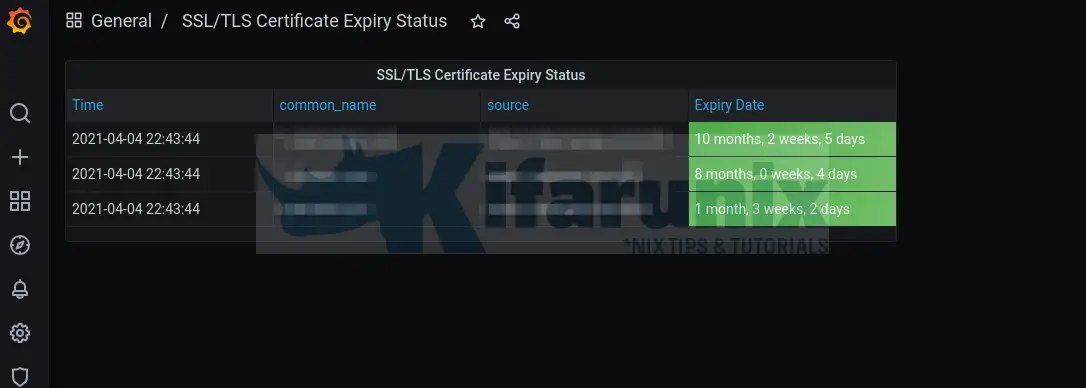
Sample Mock Dashboard;

Save the dashboard once you are done setting it up.

Here is the sample JSON file for my dashboard above;
{
  "annotations": {
    "list": [
      {
        "builtIn": 1,
        "datasource": "-- Grafana --",
        "enable": true,
        "hide": true,
        "iconColor": "rgba(0, 211, 255, 1)",
        "name": "Annotations & Alerts",
        "type": "dashboard"
      }
    ]
  },
  "editable": true,
  "gnetId": null,
  "graphTooltip": 0,
  "id": 2,
  "links": [],
  "panels": [
    {
      "datasource": null,
      "description": "",
      "fieldConfig": {
        "defaults": {
          "color": {
            "mode": "thresholds"
          },
          "custom": {
            "align": "left",
            "filterable": false
          },
          "mappings": [],
          "thresholds": {
            "mode": "absolute",
            "steps": [
              {
                "color": "green",
                "value": null
              },
              {
                "color": "red",
                "value": 80
              }
            ]
          }
        },
        "overrides": [
          {
            "matcher": {
              "id": "byName",
              "options": "Value #A"
            },
            "properties": [
              {
                "id": "unit",
                "value": "dtdurations"
              },
              {
                "id": "decimals",
                "value": 2
              },
              {
                "id": "custom.displayMode",
                "value": "color-background"
              },
              {
                "id": "displayName",
                "value": "Expiry Date"
              },
              {
                "id": "thresholds",
                "value": {
                  "mode": "absolute",
                  "steps": [
                    {
                      "color": "red",
                      "value": null
                    },
                    {
                      "color": "semi-dark-orange",
                      "value": 864000
                    },
                    {
                      "color": "green",
                      "value": 2592000
                    }
                  ]
                }
              }
            ]
          }
        ]
      },
      "gridPos": {
        "h": 5,
        "w": 11,
        "x": 0,
        "y": 0
      },
      "id": 2,
      "options": {
        "frameIndex": 1,
        "showHeader": true
      },
      "pluginVersion": "7.5.2",
      "targets": [
        {
          "exemplar": true,
          "expr": "x509_cert_expiry{san!=\"\"}",
          "format": "table",
          "instant": true,
          "interval": "",
          "legendFormat": "",
          "refId": "A"
        }
      ],
      "title": "SSL/TLS Certificate Expiry Status",
      "transformations": [
        {
          "id": "merge",
          "options": {}
        },
        {
          "id": "organize",
          "options": {
            "excludeByName": {
              "__name__": true,
              "common_name": false,
              "host": true,
              "instance": true,
              "issuer_common_name": true,
              "job": true,
              "public_key_algorithm": true,
              "san": true,
              "serial_number": true,
              "signature_algorithm": true,
              "verification": true,
              "verification_error": true
            },
            "indexByName": {},
            "renameByName": {}
          }
        }
      ],
      "type": "table"
    }
  ],
  "schemaVersion": 27,
  "style": "dark",
  "tags": [],
  "templating": {
    "list": []
  },
  "time": {
    "from": "now-6h",
    "to": "now"
  },
  "timepicker": {},
  "timezone": "",
  "title": "SSL/TLS Certificate Expiry Status",
  "uid": "nRouqJ_Gk",
  "version": 1
}
Other related tutorials
Monitor SSL/TLS Certificates Expiry with Nagios
Monitor Linux System Metrics with Prometheus Node Exporter
Monitoring Gitlab Metrics with Prometheus and Grafana


Hi,
the article is really nice. I was wondering if it is possible to configure alerts to get an email if a certificate is going to expire. I did not find the way to do that.
Thank you very much.
Thanks for the feedback Alessio.
Unfortunately, the alerts are only applicable to grafana graphs and not tables, which is used in this case.
You can however check our guide on how to Configure Grafana Email Alerting