In this tutoria, we are going to learn how to monitor Linux system metrics with Prometheus Node Exporter. Node Exporter is a Prometheus exporter for hardware and OS metrics exposed by *NIX kernels such as CPU, disk, memory usage etc with pluggable metrics collectors.
Learn how to install Prometheus server on Ubuntu 18.04 by visiting the link below;
Install Prometheus on Ubuntu 18.04
Monitor Linux System Metrics with Prometheus Node Exporter
This guide uses Ubuntu 18.04 as a system to collect system metrics from using the Node Exporter.
Installing Prometheus Node Exporter on Ubuntu 18.04
Create Node Exporter System User
To run the Node Exporter safely, you need to create a user for it. Hence, run the commands below to create a non-login node_exporter user.
useradd -M -r -s /bin/false node_exporterThis will create a node_exporter user with the same group as the username.
id node_exporter
uid=998(node_exporter) gid=997(node_exporter) groups=997(node_exporter)
Download and Install Node Exporter
Next, navigate to Prometheus downloads page and grab the Node Exporter tarball.
wget https://github.com/prometheus/node_exporter/releases/download/v0.18.0/node_exporter-0.18.0.linux-amd64.tar.gzOnce the download is done, run the command below to extract it.
tar xzf node_exporter-0.18.0.linux-amd64.tar.gzCopy the Node Exporter binary from the archive folder to /usr/local/bin.
cp node_exporter-0.18.0.linux-amd64/node_exporter /usr/local/bin/Set the user and group ownership of the node_exporter binary to node_exporter user created above.
chown node_exporter:node_exporter /usr/local/bin/node_exporterRunning Node Exporter
To run the Node Exporter as a service, you need to create a Systemd service file for it.
vim /etc/systemd/system/node_exporter.service[Unit]
Description=Prometheus Node Exporter
Wants=network-online.target
After=network-online.target
[Service]
User=node_exporter
Group=node_exporter
Type=simple
ExecStart=/usr/local/bin/node_exporter
[Install]
WantedBy=multi-user.targetAs stated in the Collectors section, you can configure Node Exporter to expose specific system metrics. For example, to collect CPU, Disk usage and memory statistics, you would set the ExecStart line as;
ExecStart=/usr/local/bin/node_exporter --collector.cpu --collector.meminfo --collector.loadavg --collector.filesystemAfter that, reload the systemd manager configuration.
systemctl daemon-reloadStart and enable Node Exporter to run on system boot.
systemctl start node_exporter.service
systemctl enable node_exporter.service
To check status;
systemctl status node_exporter.service
● node_exporter.service - Prometheus Node Exporter
   Loaded: loaded (/etc/systemd/system/node_exporter.service; disabled; vendor preset: enabled)
   Active: active (running) since Thu 2019-05-30 10:24:51 EAT; 7s ago
 Main PID: 4092 (node_exporter)
    Tasks: 4 (limit: 2337)
   CGroup: /system.slice/node_exporter.service
           └─4092 /usr/local/bin/node_exporter
The Node Exporter runs on TCP port 9100. Default Prometheus port allocations description are here.
ss -altnp | grep 91
LISTEN   0         128                       *:9100                   *:*        users:(("node_exporter",pid=4162,fd=3))
Add Node Exporter Target to Prometheus
Next, login to Prometheus server and add your Node Exporter target.
vim /etc/prometheus/prometheus.yml...
# Here it's Prometheus itself.
scrape_configs:
# The job name is added as a label `job=<job_name>` to any timeseries scraped from this config.
- job_name: 'prometheus'
# metrics_path defaults to '/metrics'
# scheme defaults to 'http'.
static_configs:
- targets: ['localhost:9090']
# 10.0.0.27(server01)
- job_name: 'server01_ne'
scrape_interval: 5s
static_configs:
- targets: ['10.0.0.27:9100']
Restart Prometheus service
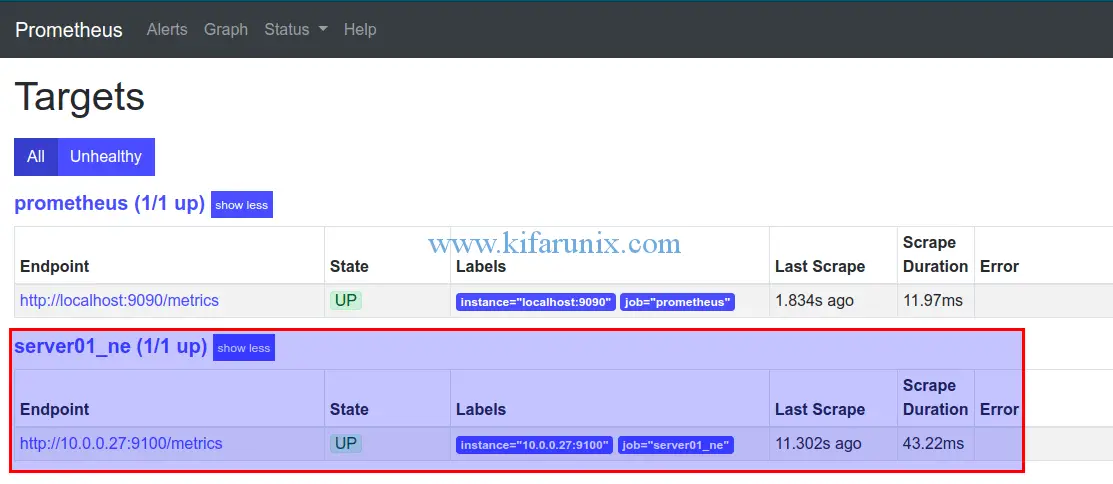
systemctl restart prometheusLogin to Prometheus web interface and check the status of your Target.

If all is well, your target should be up as shown above.
To verify that your Prometheus server can receive metrics from your node, run the command below;
curl http://<target-IP>:9100/metricsTo check for the system metrics, you can grep for the metrics prefixed with node_. For example;
curl http://10.0.0.27:9100/metrics | grep node_ | grep filesystem
...
# TYPE node_filesystem_avail_bytes gauge
node_filesystem_avail_bytes{device="/dev/mapper/ubuntu--vg-root",fstype="ext4",mountpoint="/"} 2.0969934848e+10
node_filesystem_avail_bytes{device="tmpfs",fstype="tmpfs",mountpoint="/run"} 2.07343616e+08
node_filesystem_avail_bytes{device="tmpfs",fstype="tmpfs",mountpoint="/run/lock"} 5.24288e+06
node_filesystem_avail_bytes{device="tmpfs",fstype="tmpfs",mountpoint="/run/user/0"} 2.09006592e+08
node_filesystem_avail_bytes{device="tmpfs",fstype="tmpfs",mountpoint="/run/user/1000"} 2.08973824e+08
node_filesystem_avail_bytes{device="tmpfs",fstype="tmpfs",mountpoint="/run/user/121"} 2.0897792e+08
# HELP node_filesystem_device_error Whether an error occurred while getting statistics for the given device.
# TYPE node_filesystem_device_error gauge
...
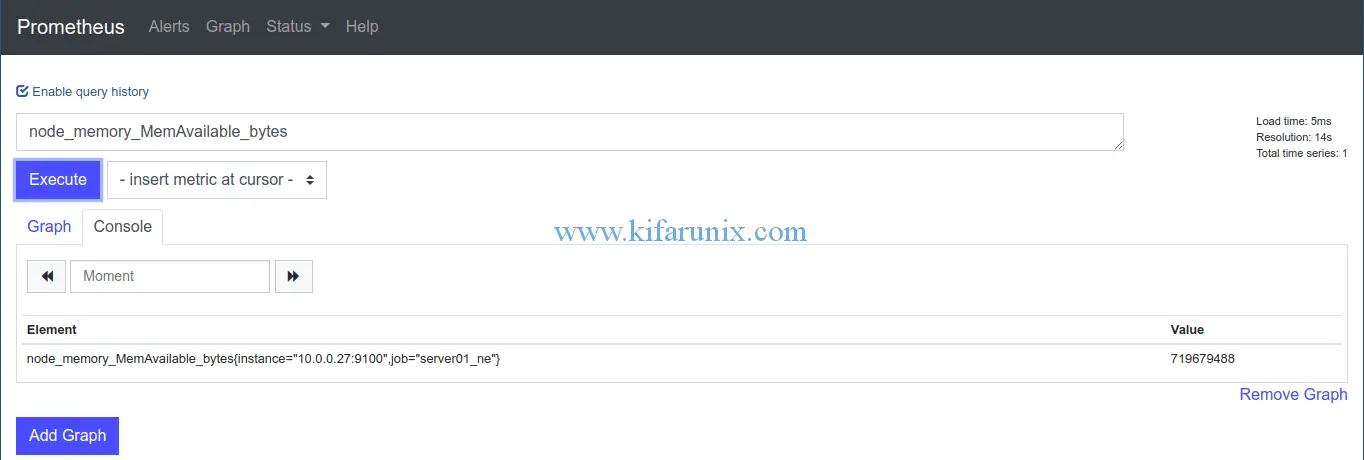
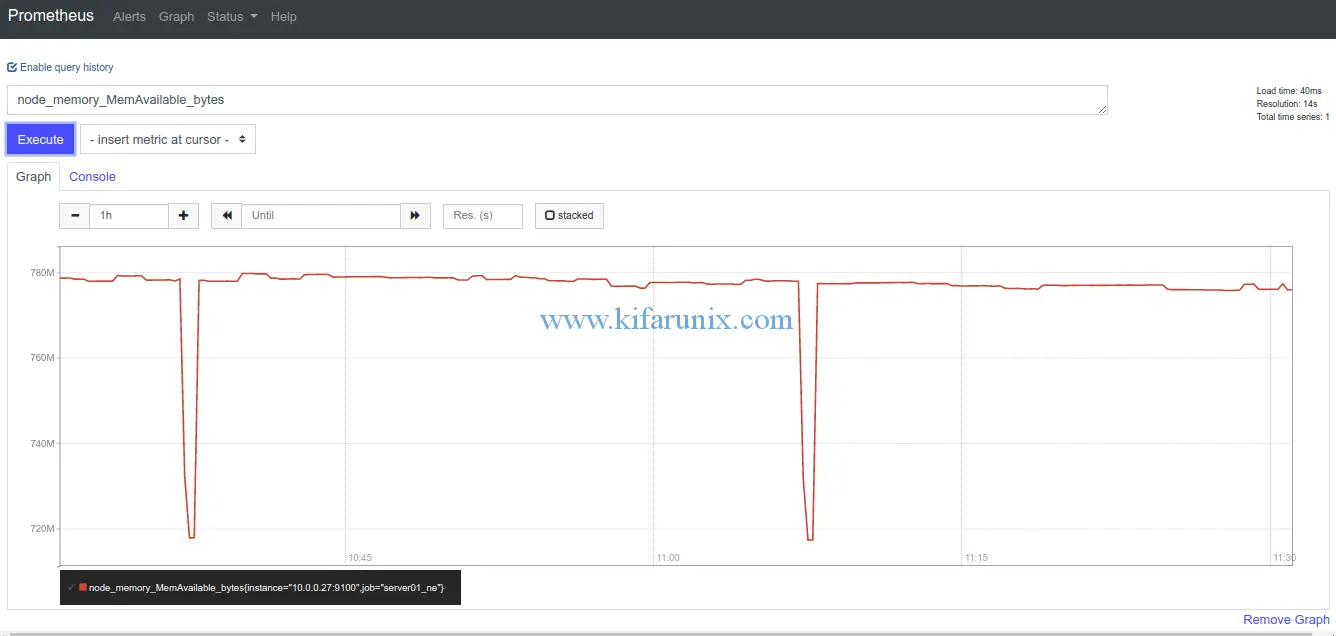
To view the metrics from Prometheus Web interface, and enter any expression for a specific metric you want to see. For example, to check the target’s available memory, you would just type, node_memory_MemAvailable_bytes and click execute. Ensure that the times in both Prometheus server and target are synchronized.

To see the Graphical view, click on the Graph tab.

You have successfully set up Prometheus node exporter to monitor remote Linux host. In our next guide, we will learn how to integrate the Prometheus with Grafana for better visualization. Enjoy.
You can check our other articles by following the links below;
Install and Configure Prometheus on Fedora 29/Fedora 28
Install and Configure Prometheus on Debian 9
Monitor Squid logs with Grafana and Graylog
Install and Setup TIG Stack on Fedora 30

