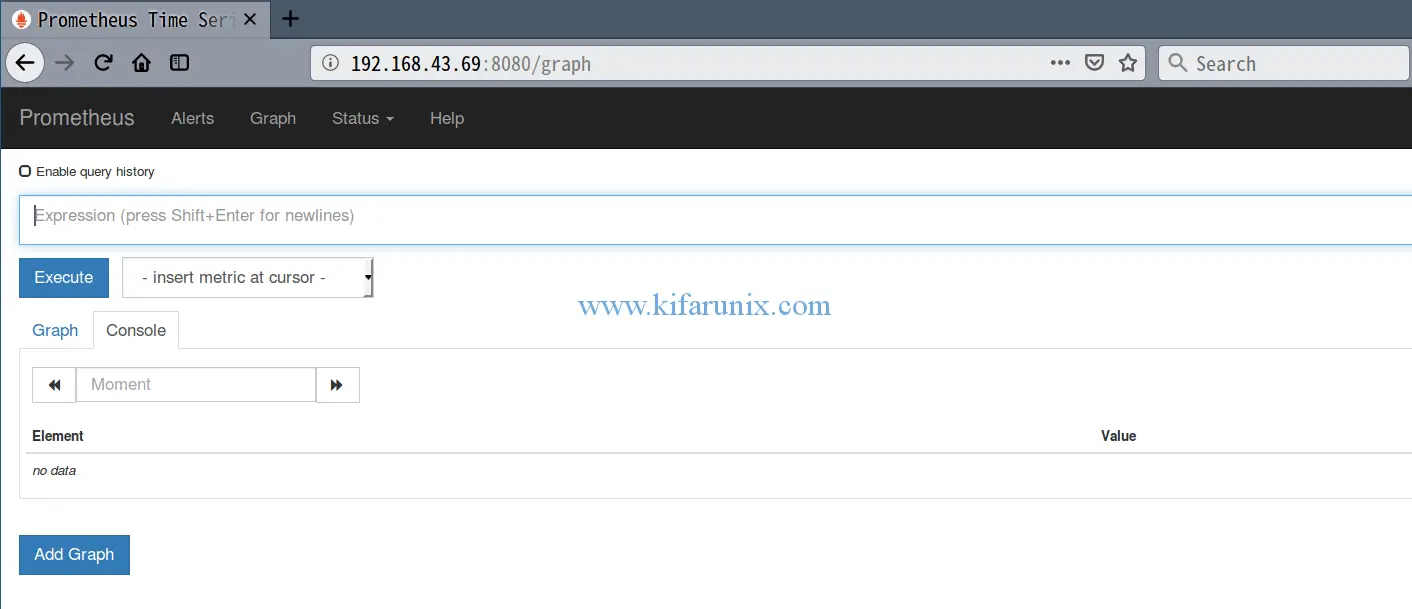
In this guide, we are going to learn how to install and configure Prometheus on Fedora 29/Fedora 28. As you already know, Prometheus is a time series collection and processing server with a dimensional data model, flexible query language, efficient time series database and modern alerting approach.
Install and Configure Prometheus on Fedora 29/Fedora 28
Step through this guide in order to install and configure Prometheus on Fedora 29/Fedora 28.
Install Prometheus on Ubuntu 18.04 by checking the link below;
Install Prometheus on Ubuntu 18.04
Create Prometheus System User and Group
To create prometheus system user and group, run the command below;
useradd -M -r -s /bin/false prometheus
To verify this, you can try to print prometheus user and group information using the id command;
getent passwd prometheus
prometheus:x:986:985::/home/prometheus:/bin/false
Create Configuration Directories
Since we are installing Prometheus from source, you need to create the respective configuration directories.
mkdir /etc/prometheus
mkdir /var/lib/prometheus
Download Prometheus Binary
In order to install the latest version of Prometheus, navigate to the Download’s Page and grab Prometheus binary for your platform. You can simply run the command below to download version 2.6.0 for Linux systems.
wget https://github.com/prometheus/prometheus/releases/download/v2.6.0/prometheus-2.6.0.linux-amd64.tar.gz
Once the download is done, extract the archive.
tar -xzf prometheus-2.6.0.linux-amd64.tar.gz
Copy the two Prometheus binary files, prometheusand promtool, under the extracted Prometheus archive directory to the /usr/local/bin directory.
cp prometheus-2.6.0.linux-amd64/prometheus /usr/local/bin/
cp prometheus-2.6.0.linux-amd64/promtool /usr/local/bin/
Copy the consoles/ and console_libraries/ directories to /etc/prometheus directory created above.
cp -r prometheus-2.6.0.linux-amd64/console /etc/prometheus/
cp -r prometheus-2.6.0.linux-amd64/console_libraries/ /etc/prometheus/
Configure Prometheus on Fedara 29/28
The sample Prometheus configuration file, prometheus.yml, is located under the extracted archive directory. Since we are doing a basic setup, we will copy the configuration file and modify it as follows such that it can scrape the local system only (Prometheus server).
cp prometheus-2.6.0.linux-amd64/prometheus.yml /etc/prometheus/
Before we proceed, it is good to note that the default port that Prometheus server listens on, TCP port 9090, is the same port the Fedora Cockpit socket listening on. As a result, if you are not using the Cockpit Web service Manager, disable and stop both the service and socket to free port 9090.
systemctl mask cockpit cockpit.socket
systemctl stop cockpit cockpit.socket
Next, open it for modification and adjust it such that it looks like;
vim /etc/prometheus/prometheus.yml
# my global config
global:
  scrape_interval:     15s # Set the scrape interval to every 15 seconds. Default is every 1 minute.
  evaluation_interval: 15s # Evaluate rules every 15 seconds. The default is every 1 minute.
  # scrape_timeout is set to the global default (10s).

# A scrape configuration containing exactly one endpoint to scrape:
# Here it's Prometheus itself.
scrape_configs:
  # The job name is added as a label `job=<job_name>` to any timeseries scraped from this config.
  - job_name: 'prometheus'

    # metrics_path defaults to '/metrics'
    # scheme defaults to 'http'.

    static_configs:
    - targets: ['localhost:9090']
If you don’t want to stop the Cockpit service, then you can configure Prometheus server to listen on a different port, say TCP port 8080. Hence adjust your configuration such that it looks like;
# my global config
global:
  scrape_interval:     15s # Set the scrape interval to every 15 seconds. Default is every 1 minute.
  evaluation_interval: 15s # Evaluate rules every 15 seconds. The default is every 1 minute.
  # scrape_timeout is set to the global default (10s).

# A scrape configuration containing exactly one endpoint to scrape:
# Here it's Prometheus itself.
scrape_configs:
  # The job name is added as a label `job=<job_name>` to any timeseries scraped from this config.
  - job_name: 'prometheus'

    # metrics_path defaults to '/metrics'
    # scheme defaults to 'http'.

    static_configs:
    - targets: ['localhost:8080']
Note the targets line above. Prometheus server is set to listen TCP port 8080.
Allow Prometheus through firewall.
firewall-cmd --add-port=9090/tcp --permanent
If it is set to listen on a different port, say 8080;
firewall-cmd --add-port=8080/tcp --permanent
Reload firewalld
firewall-cmd --reload
Set Proper Ownership on Configuration Files and Directories
Run the command below to set the ownership (owner and group) of Prometheus configuration files and directories to prometheus.
chown -R prometheus:prometheus /etc/prometheus
chown -R prometheus:prometheus /var/lib/prometheus
chown prometheus.prometheus /usr/local/bin/prometheus
chown prometheus.prometheus /usr/local/bin/promtool
Starting Prometheus
To start Prometheus with our basic configuration file,run:
prometheus --config.file=/etc/prometheus/prometheus.ymlYou should able to access the Prometheus status page at http://localhost:9090 if you are accessing the server locally or http://<server-IP>:9090 if you are accessing remotely.
If you configured Prometheus server to listen on a different port above, then you can specify the port using the --web.listen-address option as shown below;
prometheus --config.file=/etc/prometheus/prometheus.yml --web.listen-address=:8080
You can then access the Prometheus dashboard using the url http://<server-IP>:8080.
Create Prometheus Systemd Service file
To be able to run Prometheus as a service, you need to create a systemd service file, /etc/systemd/system/prometheus.service, configured as follows. Note that this assumes Prometheus server is listening on default port 9090.
vim /etc/systemd/system/prometheus.service
[Unit]
Description=Prometheus Time Series Collection and Processing Server
Wants=network-online.target
After=network-online.target

[Service]
User=prometheus
Group=prometheus
Type=simple
ExecStart=/usr/local/bin/prometheus \
    --config.file /etc/prometheus/prometheus.yml \
    --storage.tsdb.path /var/lib/prometheus/ \
    --web.console.templates=/etc/prometheus/consoles \
    --web.console.libraries=/etc/prometheus/console_libraries

[Install]
WantedBy=multi-user.target
If you configured Prometheus server to listen on non-default port, edit the ExecStart= section of the service file and add the line, --web.listen-address=0.0.0.0:8080.
...
ExecStart=/usr/local/bin/prometheus \
    --config.file /etc/prometheus/prometheus.yml \
    --storage.tsdb.path /var/lib/prometheus/ \
    --web.console.templates=/etc/prometheus/consoles \
    --web.console.libraries=/etc/prometheus/console_libraries \
    --web.listen-address=0.0.0.0:8080
Reload systemd daemon configuration.
systemctl daemon-reload
Start and Enable Prometheus service to run at boot time.
systemctl start prometheus
systemctl enable prometheus
Check the status
systemctl status prometheus
● prometheus.service - Prometheus Time Series Collection and Processing Server
   Loaded: loaded (/etc/systemd/system/prometheus.service; enabled; vendor preset: enabled)
   Active: active (running) since Wed 2019-01-09 11:22:52 EST; 1min 1s ago
 Main PID: 1649 (prometheus)
   CGroup: /system.slice/prometheus.service
           └─1649 /usr/local/bin/prometheus --config.file /etc/prometheus/prometheus.yml --storage.tsdb.path /var/lib/prometheus/ --web.console.templates=/etc/
Great, Prometheus is now running as a service.
So far so good, you have learnt how to install and configure Prometheus on Fedoara 29/Fedora 28. In our next guides, we will be covering how to monitor other targets using Prometheus. Enjoy.
Feel free to explore more about Prometheus here.


