
Welcome to our guide on how to install ELK Stack on Ubuntu 20.04. ELK, currently known as Elastic Stack, is the acronym for open source projects comprising;
- Elasticsearch: a search and analytics engine
- Kibana: a data visualization and dash-boarding tool that enables you to analyze data stored on Elasticsearch.
- Logstash: a server‑side data processing pipeline that ingests data from multiple sources simultaneously, transforms it, and then stashes it on search analytics engine like Elasticsearch
- Beats on the other hand are the log shippers that collects logs from different endpoints and sends them to either Logstash or directly to Elasticsearch.
Installing ELK Stack on Ubuntu 20.04
Installation of Elastic Stack follows a specific order. Below is the order of installing Elastic Stack components;
Run system update
Before you can start the installation, ensure that the system packages are up-to-date.
Install Elasticsearch on Ubuntu 20.04
You can install Elasticsearch automatically from Elastic repos or you can download Elasticsearch DEB binary package and install it. However, to simplify the installation of all Elastic Stack components, we will create Elastic Stack repos;
Import the Elastic stack PGP repository signing Key
wget -qO - https://artifacts.elastic.co/GPG-KEY-elasticsearch --no-check-certificate | sudo apt-key add -Install Elasticsearch;
echo "deb https://artifacts.elastic.co/packages/7.x/apt stable main" | sudo tee -a /etc/apt/sources.list.d/elastic-7.x.listUpdate package cache and install Elasticsearch;
apt updateapt install elasticsearchConfigure Elasticsearch on Ubuntu 20.04
There are only a few configuration changes we are going to make on this tutorial. First off, we configure ES to listen on a specific Interface IP to allow external access. Elasticsearch is listening on localhost by default.
vim /etc/elasticsearch/elasticsearch.ymlYou can choose to change the default cluster name;
...
# ---------------------------------- Cluster -----------------------------------
#
# Use a descriptive name for your cluster:
#
#cluster.name: my-application
cluster.name: kifarunix-demo
...
Uncomment and change the value of network.host as well the http.port line under the Network settings section.
# ---------------------------------- Network -----------------------------------
#
# Set the bind address to a specific IP (IPv4 or IPv6):
#
#network.host: 192.168.0.1
network.host: 10.10.9.9
#
# Set a custom port for HTTP:
#
http.port: 9200
#
# For more information, consult the network module documentation
Since we are running a single node Elasticsearch, specify the same in the configuration by adding the line, discovery.type: single-node under the Discovery settings section.
...
# --------------------------------- Discovery ----------------------------------
#
# Pass an initial list of hosts to perform discovery when this node is started:
# The default list of hosts is ["127.0.0.1", "[::1]"]
...
...
#cluster.initial_master_nodes: ["node-1", "node-2"]
# This is for Single Node Elastic stack
discovery.type: single-node
...
Save and exit the config.
Next, configure JVM heap size to no more than half the size of your memory. In this case, our test server has 2G RAM and the heap size is set to 512M for both maximum and minimum sizes.
vim /etc/elasticsearch/jvm.options...
################################################################
# Xms represents the initial size of total heap space
# Xmx represents the maximum size of total heap space
-Xms512m
-Xmx512m
...Those are just about the few changes we would make on ES.
Running Elasticsearch
Start and enable Elasticsearch to run on system boot;
systemctl enable --now elasticsearchTo check the status;
systemctl status elasticsearchYou can as well verify ES status using curl command. Replace the IP accordingly.
curl http://10.10.9.9:9200If you get such an output, then all is well.
{
  "name" : "ubuntu20",
  "cluster_name" : "kifarunix-demo",
  "cluster_uuid" : "3RY1LTvyTD2Bie74xGw6Vg",
  "version" : {
    "number" : "7.6.2",
    "build_flavor" : "default",
    "build_type" : "deb",
    "build_hash" : "ef48eb35cf30adf4db14086e8aabd07ef6fb113f",
    "build_date" : "2020-03-26T06:34:37.794943Z",
    "build_snapshot" : false,
    "lucene_version" : "8.4.0",
    "minimum_wire_compatibility_version" : "6.8.0",
    "minimum_index_compatibility_version" : "6.0.0-beta1"
  },
  "tagline" : "You Know, for Search"
}
Install Kibana on Ubuntu 20.04
Since we already setup Elastic repos, simply install Kibana by running the command;
apt install kibanaKibana is set to run on localhost:5601 by default. To allow external access, edit the configuration file and replace the value of server.host with an interface IP.
vim /etc/kibana/kibana.yml# Kibana is served by a back end server. This setting specifies the port to use.
server.port: 5601
...
# To allow connections from remote users, set this parameter to a non-loopback address.
#server.host: "localhost"
server.host: "10.10.9.9"Set the Elasticsearch URL
...
# The URLs of the Elasticsearch instances to use for all your queries.
#elasticsearch.hosts: ["http://localhost:9200"]
elasticsearch.hosts: ["http://10.10.9.9:9200"]
If you need to secure Kibana by proxying it with Nginx, you can check how to on our previous by following the link below;
Configure Nginx with SSL to Proxy Kibana
Running Kibana
Once the installation is done, start and enable Kibana to run on system boot.
systemctl enable --now kibanaAccess Kibana Dashboard
You can now access Kibana from your browser using the url, http://<server-IP>:5601.
If UFW is running, Open Kibana port;
ufw allow 5601/tcpUpon accessing Kibana interface, on the welcome page, you are prompted on whether to get started with Kibana sample data since we do not have any data in our cluster yet.

Install Logstash on Ubuntu 20.04
Logstash requires Java 8 or Java 11. You can use the official Oracle distribution or an open-source distribution such as OpenJDK. To install OpenJDK 11;
apt install openjdk-11-jdk -yjava --versionopenjdk 11.0.7 2020-04-14
OpenJDK Runtime Environment (build 11.0.7+10-post-Ubuntu-3ubuntu1)
OpenJDK 64-Bit Server VM (build 11.0.7+10-post-Ubuntu-3ubuntu1, mixed mode, sharing)Since we already have Elastic repos in place, install Logstash by running the command below;
apt install logstashOnce the installation is done, configure Logstash to process any data to be collected from the remote hosts. Follow the link below to learn how to configure Logstash.
How to Configure Logstash data processing pipeline
Install Filebeat on Ubuntu 20.04
Filebeat is a lightweight shipper for collecting, forwarding and centralizing event log data. It is installed as an agent on the servers you are collecting logs from. It can forward the logs it is collecting to either Elasticsearch or Logstash for indexing.
To install Filebeat from Elastic repos;
apt install filebeatOnce the installation, follow the link below to configure Filebeat for data collection.
Configure Filebeat log shipper on Ubuntu
Verify Elasticsearch Index Data Reception
Once you have configured Filebeat to ship authentication logs to Logstash for processing, you can verify is any data has been written to the index defined. For example, in our example setup provided in the link above, we are sending SSH authentication events to ssh_auth-YYYY.MM index. This can be verified by querying status of ES indices.
curl -XGET http://10.10.9.9:9200/_cat/indices?vhealth status index uuid pri rep docs.count docs.deleted store.size pri.store.size
green open .kibana_task_manager_1 BkfUXSstQdGhcOAD9EyhvQ 1 0 2 0 31.9kb 31.9kb
green open .apm-agent-configuration duVPmKSWQj6k_hGzezyheg 1 0 0 0 283b 283b
green open ilm-history-1-000001 pvdSCTQDQXWwlzdlEY1ykg 1 0 18 0 25.3kb 25.3kb
green open .kibana_1 aU6EZ-c4RTGQOsH7coOUqg 1 0 8 0 22.7kb 22.7kb
yellow open ssh_auth-2020.05 xVQyHuz2SWCEFMQFKYWVDA 1 1 186 0 248.5kb 248.5kbFrom the output, you can see that our SSH index has data. For health color status, read more on Cluster Health API.
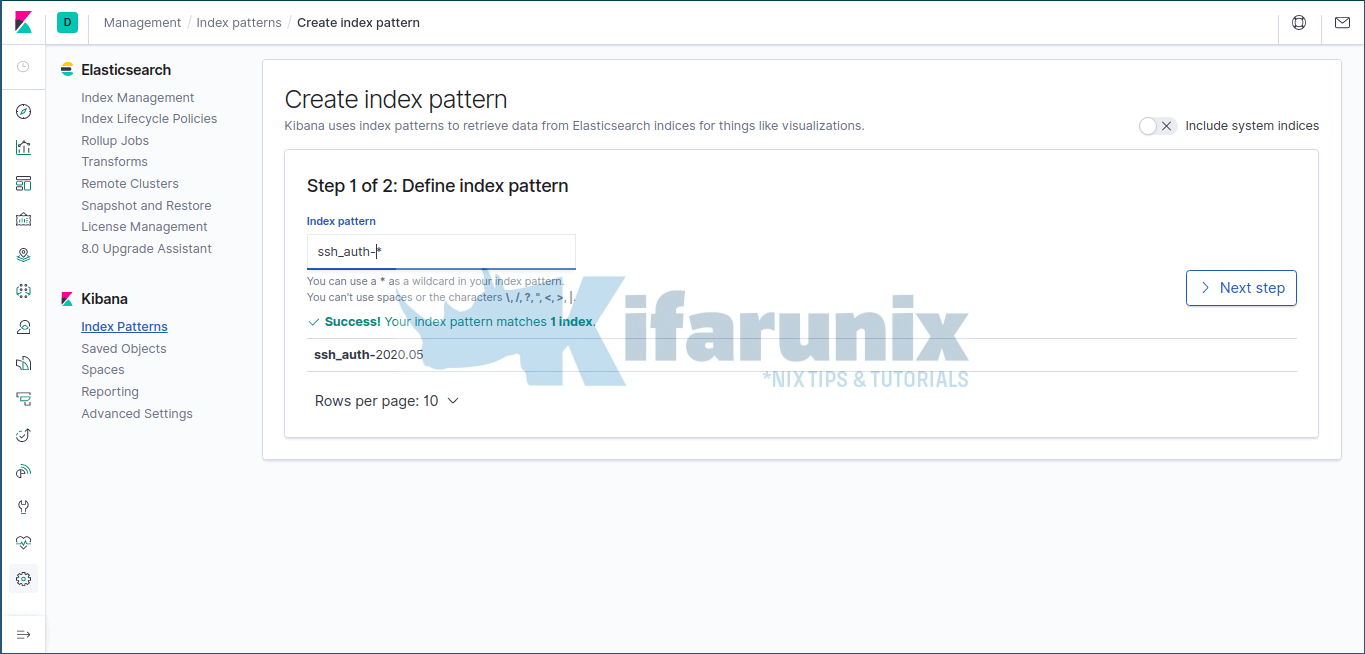
To confirm data reception on Kibana, navigate to Kibana dashboard on the web browser and create your index. Click on Management tab (on the left side panel) > Kibana> Index Patterns > Create Index Pattern. Enter the wildcard for your index name.
Click Next and select timestamp as the time filter.
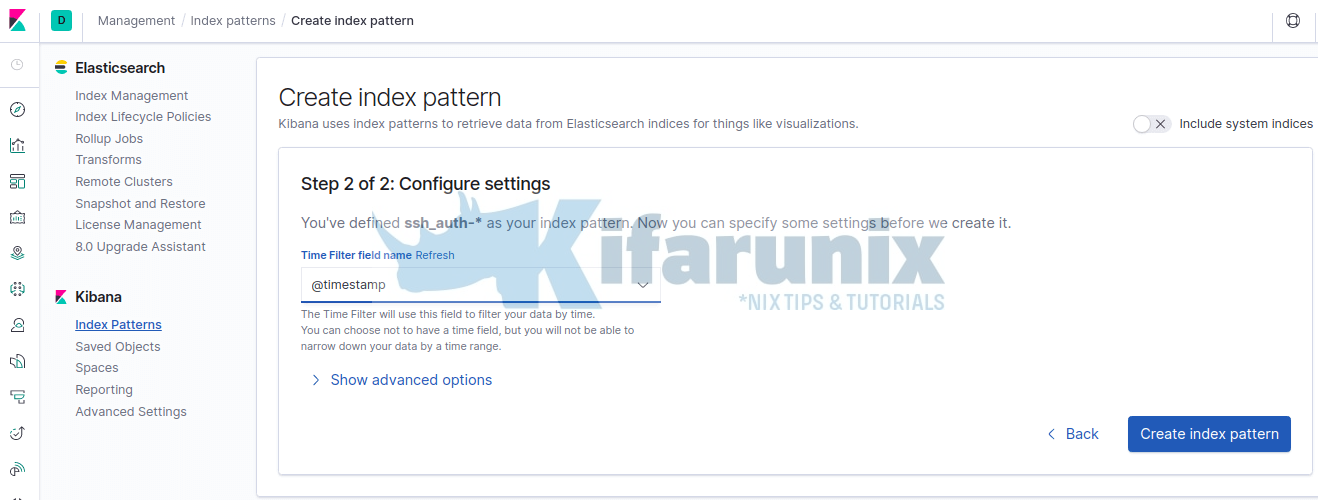
Then click Create Index pattern to create your index pattern.
View Data on Kibana
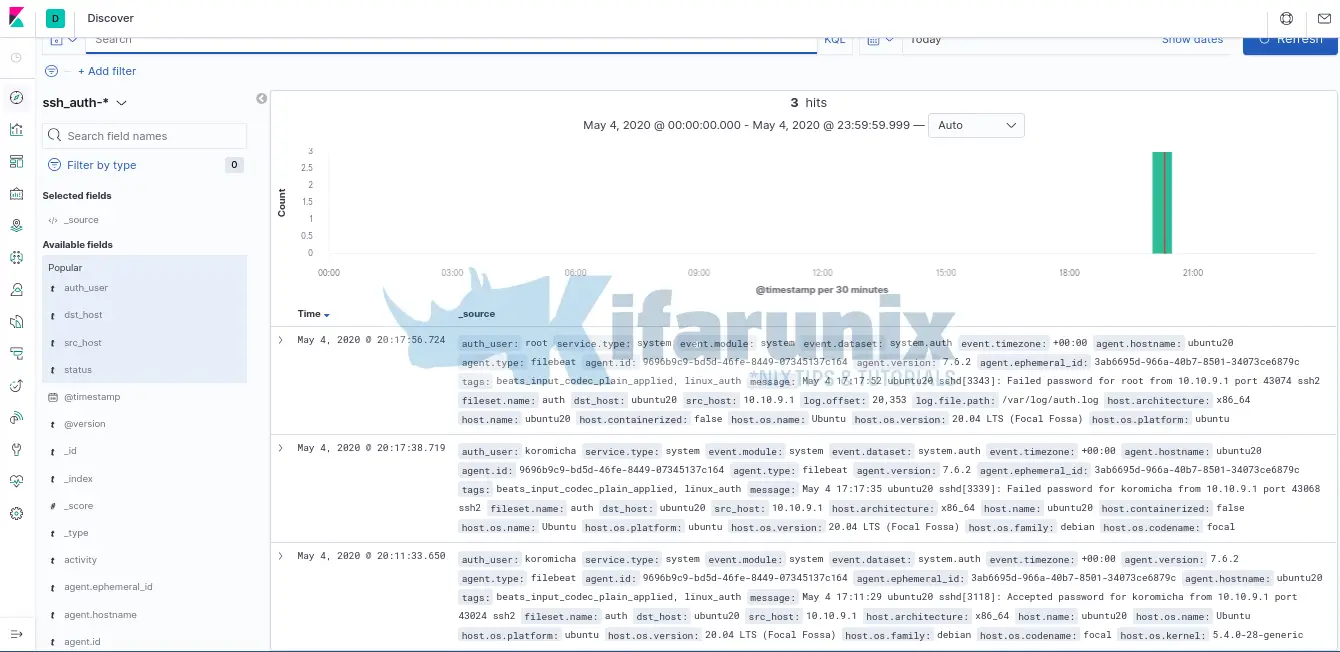
Once that is done, you can now view your event data on Kibana by clicking on the discover tab on the left pane. Expand your time range accordingly.
To filter the SSH events just processed with Logstash, add the fields that were defined on the Logstash grok filter pattern;
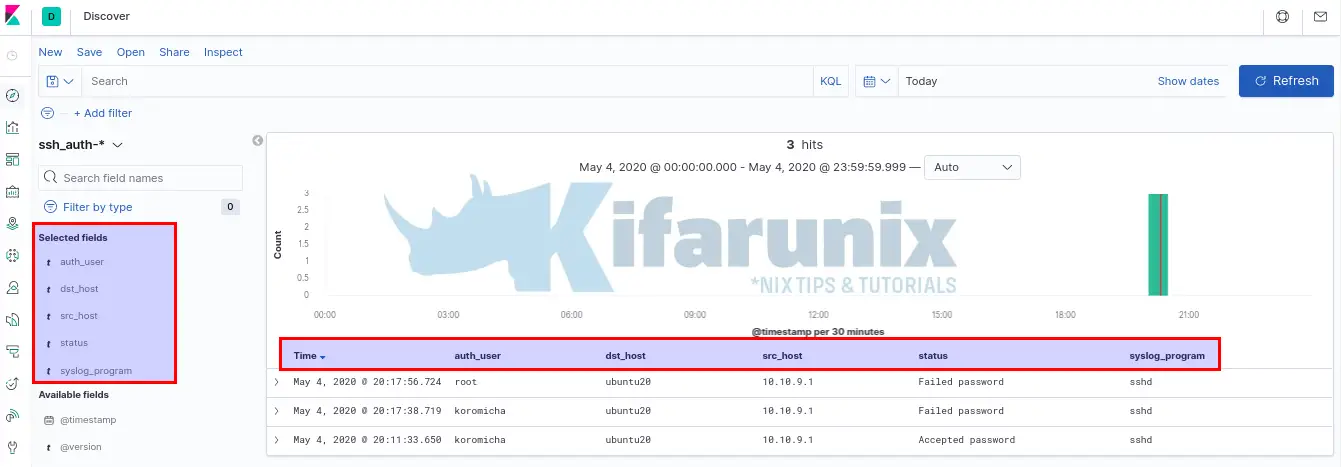
And there you go. You can now ingest more data and create Logstash filters if you need further processing before the events gets to ES.
Reference
Related Tutorials
Installing ELK Stack on CentOS 8
Install Elastic Stack 7 on Fedora 30/Fedora 29/CentOS 7


My Kibana show this message: Kibana server is not ready yet
Hello Cid,
Is your Elasticsearch running yet? If so, check that you define the correct address for Es on Kibana.yml.
Regards,