In this tutorial, we are going to learn how to monitor system metrics with TICK stack on Ubuntu 20.04. TICK stack is an acronym for a collection of opensource tools including Telegraf, InfluxDB, Chronograf and Kapacitor. Each of these tools offers different functionality:
- Telegraf: It is a metrics collection agent. It collects system metrics and sends them to InfluxDB.
- InfluxDB: It is an open source time series database, built by InfluxData, for monitoring system metrics and events. It is designed to handle high write and query loads and thus can be used to store large amounts of time stamped data, including DevOps monitoring, application metrics, IoT sensor data, and real-time analytics.
- Chronograf: is a visualization tool for the whole TICK stack. Use it to set up graphs and dashboards of monitoring data in InfluxDB as well as create alerting and automation rules.
- Kapacitor: is a metrics and events processing and alerting engine. Use it to crunch time series data into actionable alerts and easily send those alerts to many popular products like Sensu, Slack, Telegram etc.
As much as these components inter-operate, you can use each one of them separately in standalone setup.
We covered the installation and setup of TIG stack on Ubuntu 20.04 in our previos guide, which shares the same components as TICK stack except that it uses Grafana instead of Chronograf and it doesnt use Kapacitor.
Install and Setup TIG Stack on Ubuntu 20.04
Monitoring System Metrics with TICK Stack
In order to setup TICK Stack to monitor system metrics on Ubuntu 20.04, we will install and setup each of the components individually.
Install InfluxDB on Ubuntu 20.04
We already covered the installation and configuration of InfluxDB on Ubuntu 20.04 in our previous guide on TIG stack.
How to install InfluxDB on Ubuntu 20.04
Configure InfluxDB to store Metrics collected by Telegraf
Enable InfluxDB HTTP Authentication
To further configure InfluxDB, we are going to enable HTTP authentication. This can be done by uncommenting the line, auth-enabled = false, under the [http] section on influxdb configuration file and setting the value to true.
Note that in the InfluxDB configuration guide above, we created a user, telegraf, with all privileges granted on the database, telegraf. You will need to specify this username and password in the Telegraf configuration file, InfluxDB output section.
Before you can enable InfluxDB HTTP authentication, you need to have at least one administrative user on the database. Create admin user as follows;
influxuse telegrafcreate user admin with password 'myAdminP@ssword' with all privilegesTo list users;
show usersuser admin
---- -----
telegraf false
admin trueNext, enable HTTP authentication.
vim /etc/influxdb/influxdb.conf[http]
# Determines whether HTTP endpoint is enabled.
enabled = true
...
# The bind address used by the HTTP service.
bind-address = ":8086"
# Determines whether user authentication is enabled over HTTP/HTTPS.
auth-enabled = trueSave and exit the configuration file and restart InfluxDB service.
systemctl restart influxdbInstall and Configure Telegraf on Ubuntu 20.04
Follow the links below to install and configure of Telegraf.
How to install Telegraf on Ubuntu 20.04
How to configure Telegraf to collect system metrics on Ubuntu 20.04
Since we have enabled InfluxDB HTTP user authentication, ensure that you define the InfluxDB database username and password on Telegraf configuration.
vim /etc/telegraf/telegraf.conf...
[[outputs.influxdb]]
urls = ["http://127.0.0.1:8086"]
database = "telegraf"
username = "telegraf"
password = "myP@SSword"
...Restart Telegraf;
systemctl restart telegrafInstall and Configure Kapacitor on Ubuntu 20.04
You can install Kapacitor on Ubuntu 20.04 from the InfluxData repositories or you can simply download the debian binary package file and install it.
Install Kapacitor from InfluxData repos
Create InfluxData repository and install Kapacitor;
wget -qO- https://repos.influxdata.com/influxdb.key | sudo apt-key add -source /etc/lsb-releaseecho "deb https://repos.influxdata.com/${DISTRIB_ID,,} ${DISTRIB_CODENAME} stable" | sudo tee /etc/apt/sources.list.d/influxdb.listapt updateapt install kapacitorInstall Kapacitor using Debian Package file
Download Kapacitor from InfluxData downloads page.
wget https://dl.influxdata.com/kapacitor/releases/kapacitor_1.5.5-1_amd64.debdpkg -i kapacitor_1.5.5-1_amd64.debConfigure Kapacitor
Open the Kapacitor configuration file and define the InfluxDB HTTP authentication credentials.
vim /etc/kapacitor/kapacitor.conf...
[[influxdb]]
# Connect to an InfluxDB cluster
# Kapacitor can subscribe, query and write to this cluster.
# Using InfluxDB is not required and can be disabled.
enabled = true
default = true
name = "localhost"
urls = ["http://localhost:8086"]
username = "admin"
password = "myAdminP@ssword"
timeout = 0
...You can display Kapacitor configuration using;
kapacitord configTo use Kapacitor with an InfluxDB instance that requires authentication, it must authenticate using an InfluxDB user with read and write permissions.
Once done with configuration, start and enable Kapacitor to run on system boot;
systemctl enable --now kapacitorVerify the status;
systemctl status kapacitor● kapacitor.service - Time series data processing engine.
Loaded: loaded (/lib/systemd/system/kapacitor.service; enabled; vendor preset: enabled)
Active: active (running) since Sun 2020-05-31 10:01:00 UTC; 2min 2s ago
Docs: https://github.com/influxdb/kapacitor
Main PID: 13967 (kapacitord)
Tasks: 10 (limit: 2282)
Memory: 11.3M
CGroup: /system.slice/kapacitor.service
└─13967 /usr/bin/kapacitord -config /etc/kapacitor/kapacitor.conf
May 31 10:01:00 ubuntu20 systemd[1]: Started Time series data processing engine..
May 31 10:01:00 ubuntu20 kapacitord[13967]: '##:::'##::::'###::::'########:::::'###:::::'######::'####:'########::'#######::'########::
May 31 10:01:00 ubuntu20 kapacitord[13967]: ##::'##::::'## ##::: ##.... ##:::'## ##:::'##... ##:. ##::... ##..::'##.... ##: ##.... ##:
May 31 10:01:00 ubuntu20 kapacitord[13967]: ##:'##::::'##:. ##:: ##:::: ##::'##:. ##:: ##:::..::: ##::::: ##:::: ##:::: ##: ##:::: ##:
May 31 10:01:00 ubuntu20 kapacitord[13967]: #####::::'##:::. ##: ########::'##:::. ##: ##:::::::: ##::::: ##:::: ##:::: ##: ########::
May 31 10:01:00 ubuntu20 kapacitord[13967]: ##. ##::: #########: ##.....::: #########: ##:::::::: ##::::: ##:::: ##:::: ##: ##.. ##:::
May 31 10:01:00 ubuntu20 kapacitord[13967]: ##:. ##:: ##.... ##: ##:::::::: ##.... ##: ##::: ##:: ##::::: ##:::: ##:::: ##: ##::. ##::
May 31 10:01:00 ubuntu20 kapacitord[13967]: ##::. ##: ##:::: ##: ##:::::::: ##:::: ##:. ######::'####:::: ##::::. #######:: ##:::. ##:
May 31 10:01:00 ubuntu20 kapacitord[13967]: ..::::..::..:::::..::..:::::::::..:::::..:::......:::....:::::..::::::.......:::..:::::..::
May 31 10:01:00 ubuntu20 kapacitord[13967]: 2020/05/31 10:01:00 Using configuration at: /etc/kapacitor/kapacitor.confYou can as well check Kapacitor tasks;
kapacitor list tasksID Type Status Executing Databases and Retention PoliciesInstall and Configure Chronograf on Ubuntu 20.04
Similarly, Chronograf can be installed either using the debian package file or from the InfluxData repos created above.
To install from InfluxData repos;
apt install chronografIf you want to install using the debian package file;
wget https://dl.influxdata.com/chronograf/releases/chronograf_1.8.4_amd64.debdpkg -i chronograf_1.8.4_amd64.debRunning Chronograf
Chronograf is started and enabled to run on system boot after installation.
systemctl status chronograf● chronograf.service - Open source monitoring and visualization UI for the entire TICK stack.
Loaded: loaded (/lib/systemd/system/chronograf.service; enabled; vendor preset: enabled)
Active: active (running) since Sun 2020-05-31 10:10:31 UTC; 1min 4s ago
Docs: https://www.influxdata.com/time-series-platform/chronograf/
Main PID: 14214 (chronograf)
Tasks: 8 (limit: 2282)
Memory: 17.0M
CGroup: /system.slice/chronograf.service
└─14214 /usr/bin/chronograf
May 31 10:10:31 ubuntu20 systemd[1]: Started Open source monitoring and visualization UI for the entire TICK stack..
May 31 10:10:37 ubuntu20 chronograf[14214]: time="2020-05-31T10:10:37Z" level=info msg="Serving chronograf at http://[::]:8888" component=server
...systemctl is-enabled chronografenabledConfiguring Chronograf
Further configuration of Chronograf can be finalized from the browser.
Open Chronograf Port on Firewall
If UFW is running, open Chronograf TCP port 8888 to allow external access.
ufw allow 8888/tcpAccessing Chronograf Web UI
Access Chronograf using the address, http://server-IP-or-resolvable-hostname:8888. On Chronograf dashboard, click Get Started.
Enter the Telegraf database and username connection details. Leave the retention policy to go with the default policy settings.
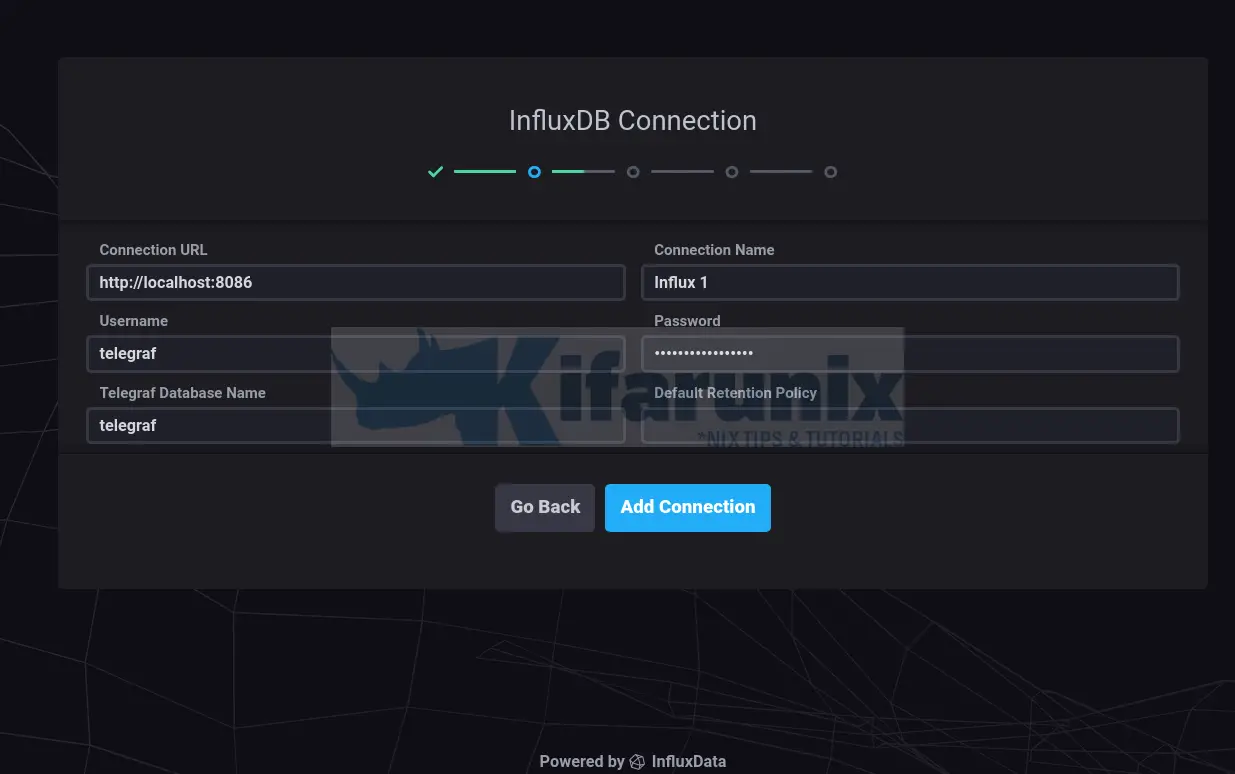
Click Add Connection to connect to Telegraf database. If the credentials provided are correct, you should see a message stating successful connection.
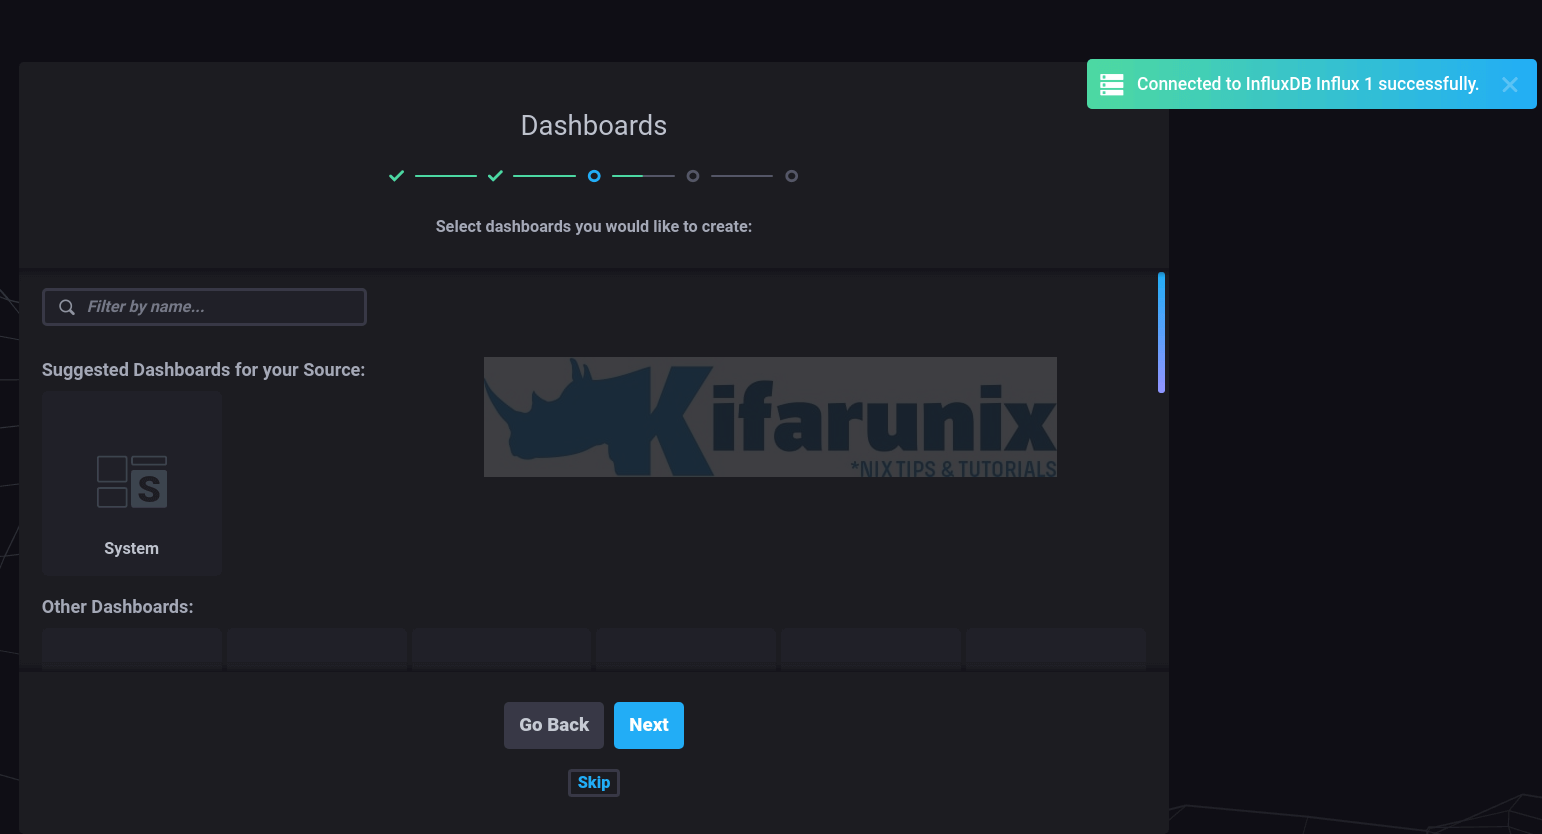
Next, select the dashboard from the provided list. In our case, we will chose the suggested system dashboard.
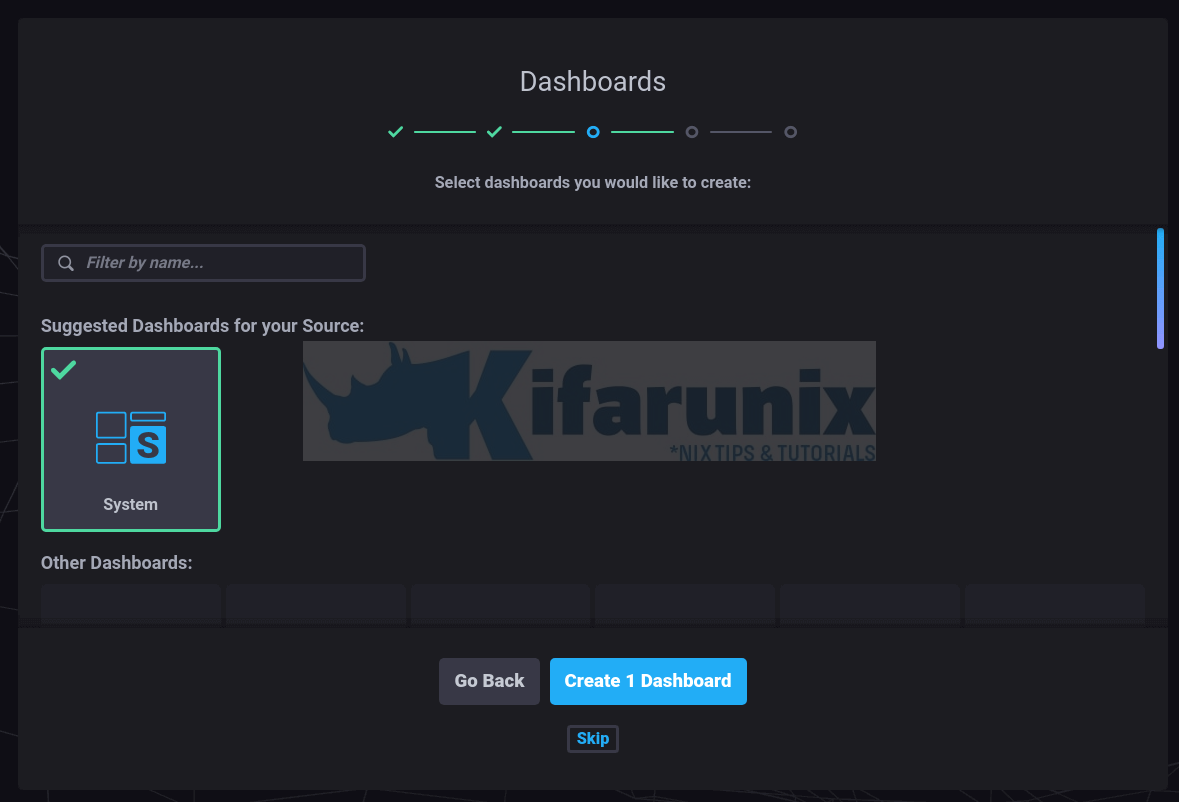
Click on the dashboard and click Create Dashboard.
Next, connect Chronograf to Kapacitor. Set the name of Kapacitor. For credentials, since we didn’t set any, just leave them blank.
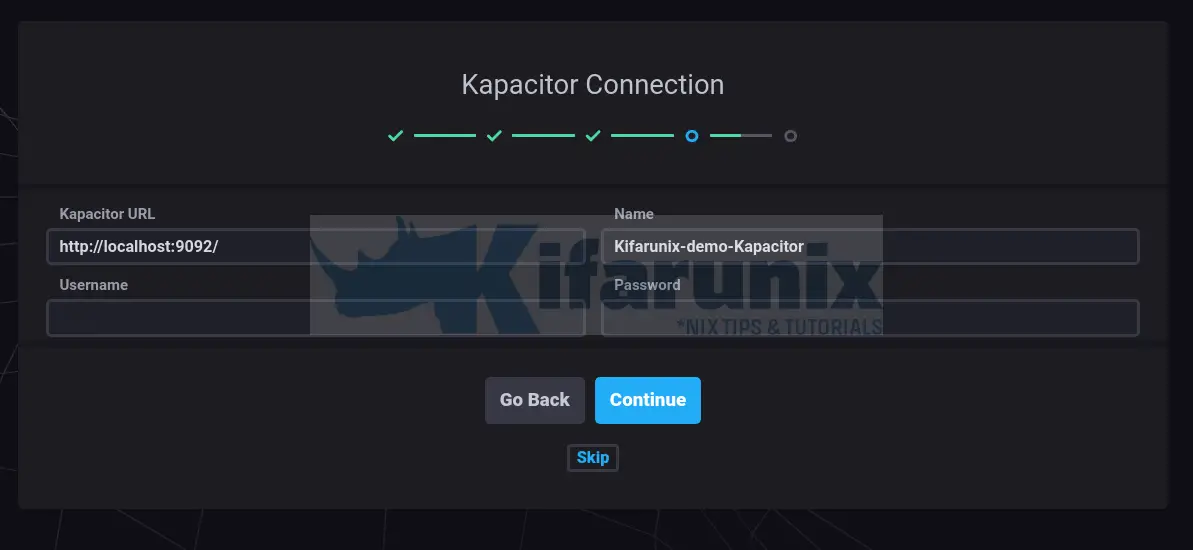
Click Continue to configure the connection. If all is well, you should see a connection success message.
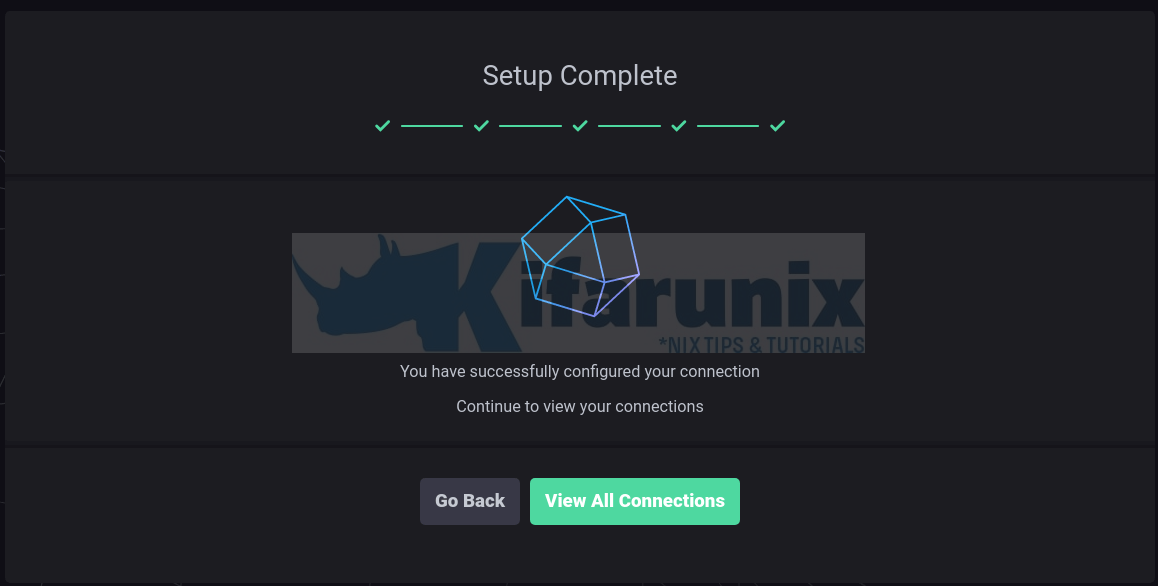
The setup is now complete. Click View All Connections to see all InfluxDB connections.
Viewing Chronograf System Dashboards
Click on the Chronograf dashboards icon.
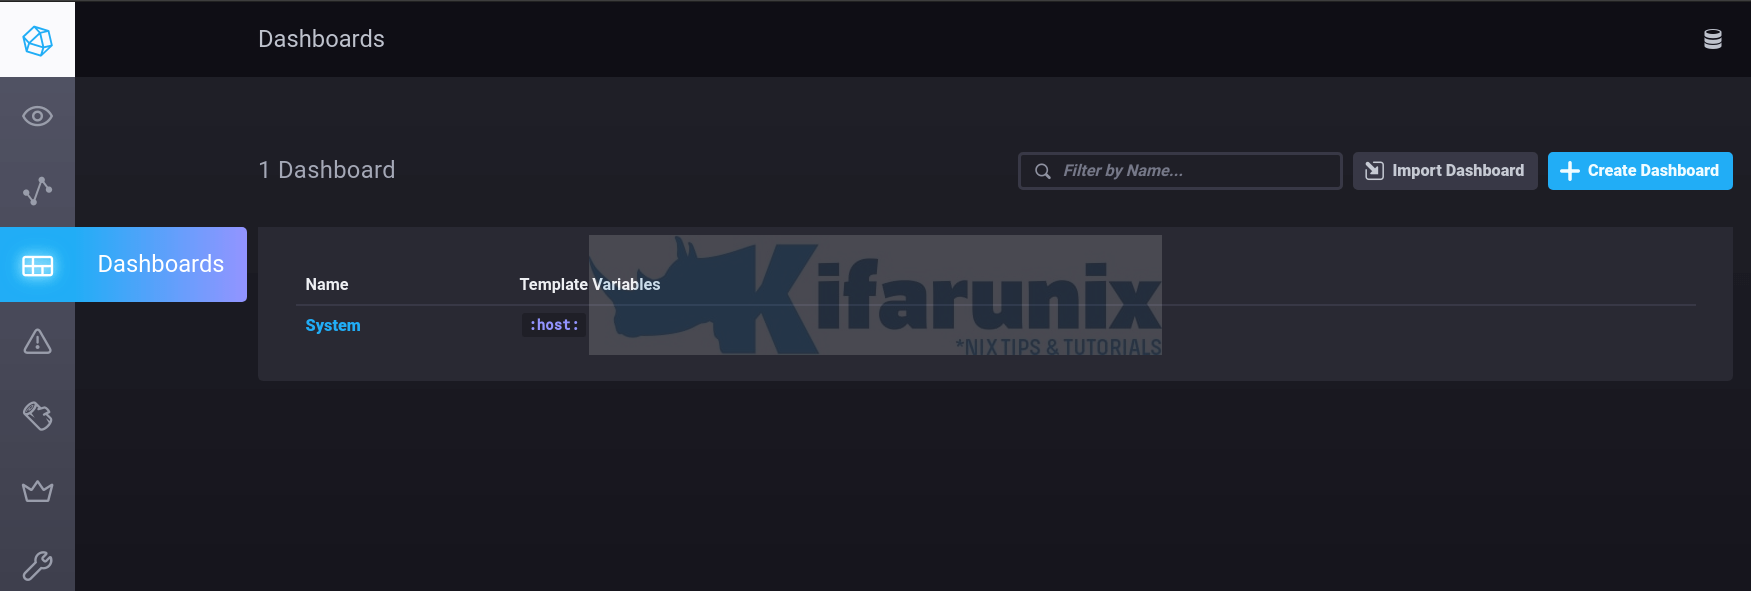
Select system dashboard to view system metrics.
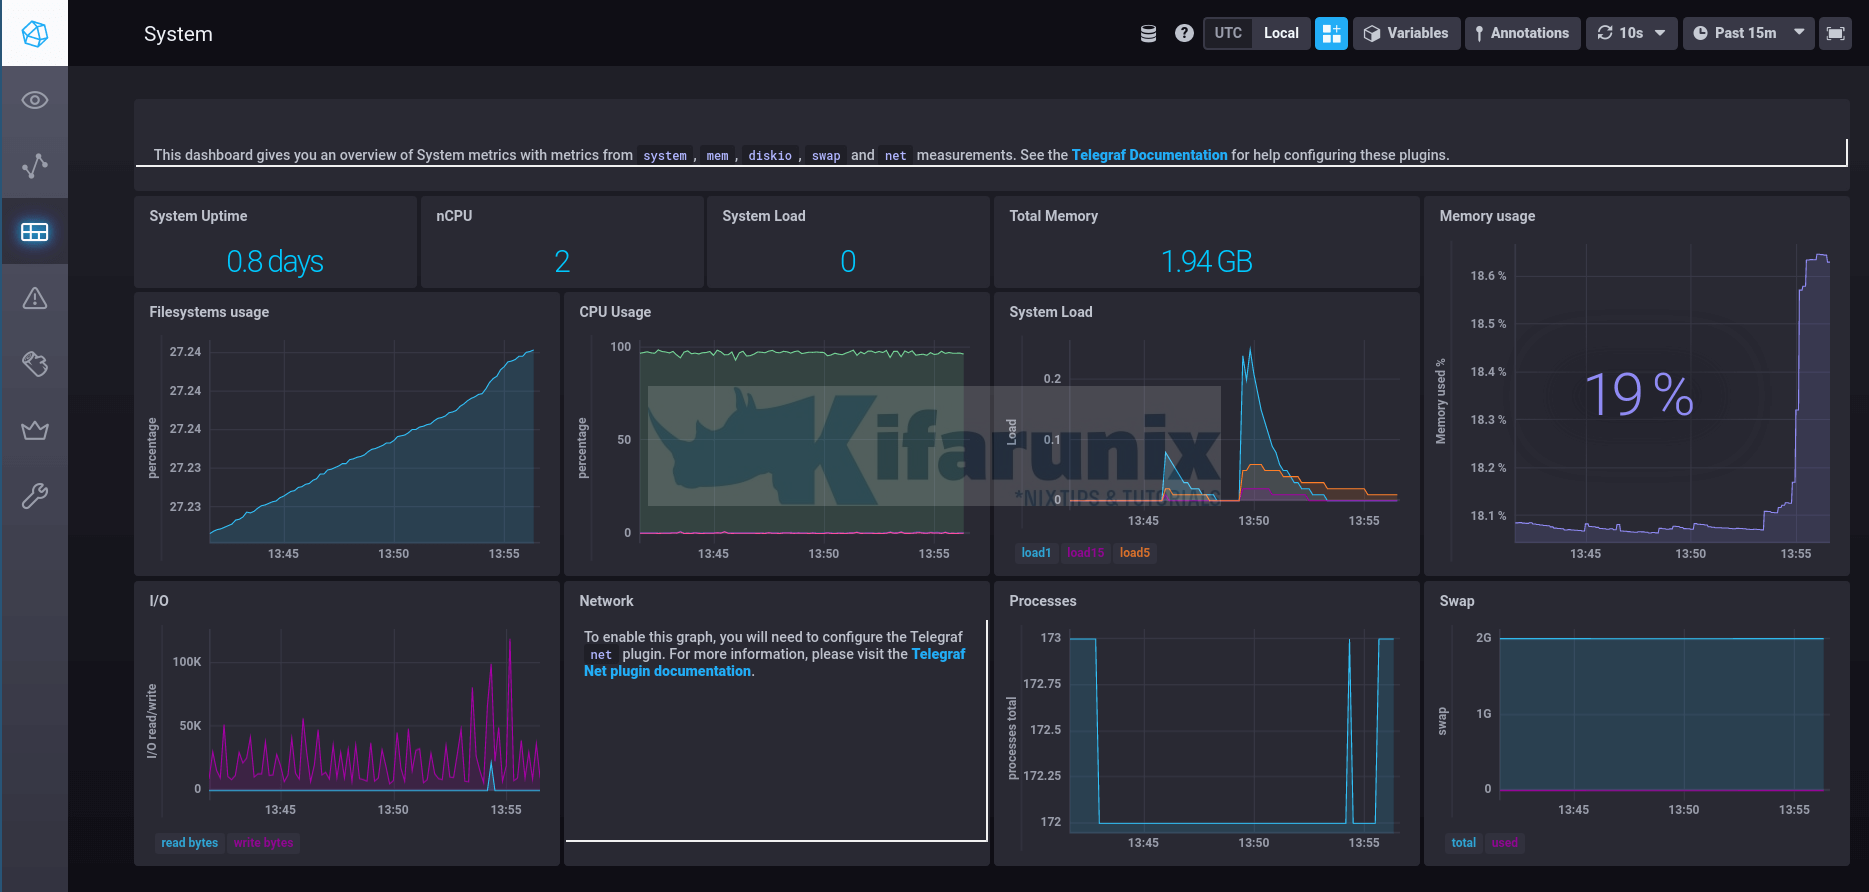
And there you go. Beautiful, isn’t?
That is just it on our tutorial on how to monitor system metrics with TICK stack. Stay tuned for more related tutorials.
Further Reading
Related Tutorials
Install and Setup TIG Stack on Fedora 30

