In this tutorial, you will learn how to configure Grafana Email alerting. Grafana alerting allows you to attach rules to your dashboard panels. When you save the dashboard, Grafana extracts the alert rules into a separate alert rule storage and schedules them for evaluation. When an alert changes state, it sends out notifications through various channels including Email, Slack, Google Hangout Chat or several other integrations.
Note that Alerting is only available in Grafana v4.0 and above and is only supported on graph panels, at least as at now.
Configuring Grafana Email Alerting
There are several notification channels that you can configure your Grafana to sent alerts through. However, this tutorial focuses on using Email alerting.
To demonstrate Grafana Email alerting, we have created dashboards for monitoring system metrics using Prometheus and Grafana. See the dashboard below for visualizing the load average for a system.
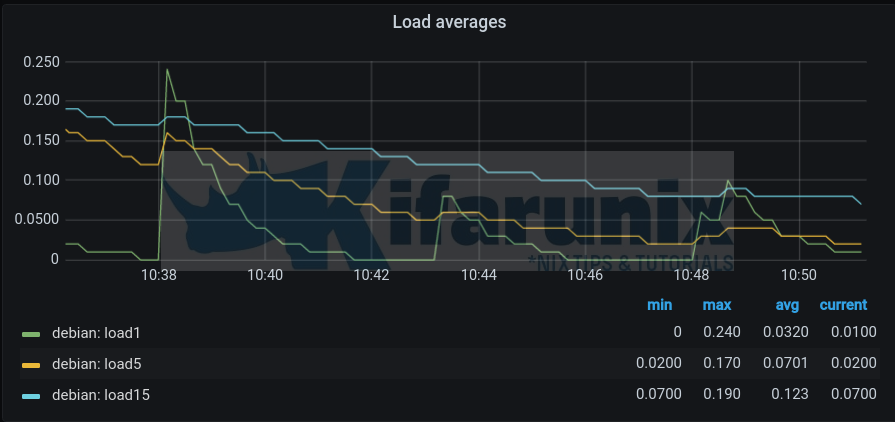
To easily demonstrate Grafana email alerting, we will setup Grafana to sent alerts when the load for the last 1, 5, 15 mins is 3.00,2.00,1.00.
Configure Grafana SMTP settings
Before Grafana can be able to sent email alerts, you need to configure how alerts will be relayed.
In this demo, we will configure Grafana to Gmail relay to sent out emails. You can use any of your preferred mail servers.
Hence, open the Grafana configuration file and navigate to smtp section.
Check the values for the highlighted lines and replace them accordingly.
vim /etc/grafana/grafana.ini[smtp]
enabled = true
host = smtp.gmail.com:587
user = [email protected]
# If the password contains # or ; you have to wrap it with triple quotes. Ex """#password;"""
password = """pass123#"""
;cert_file =
;key_file =
skip_verify = true
from_address = [email protected]
from_name = GrafanaPay attention to the line, # If the password contains # or ; you have to wrap it with triple quotes. Ex “””#password;”””.
Save and exit the file.
Restart Grafana service;
systemctl restart grafana-serverNote: If you are using Gmail relay, ensure that you turn on less secure apps to sent mails.
Add Grafana Notification Channel
Click Alerting icon (bell like icon) on the Grafana side bar and then click Notification channel. This should open up the Alerts and Notifications page;

Click Add Channel to create a new Email notification channel
- Set the name of the channel
- Choose the channel notification method, Email is used in this case.
- Enter addresses of the recipients. Multiple addresses are separated using semi-colon.
- Select your notification settings;
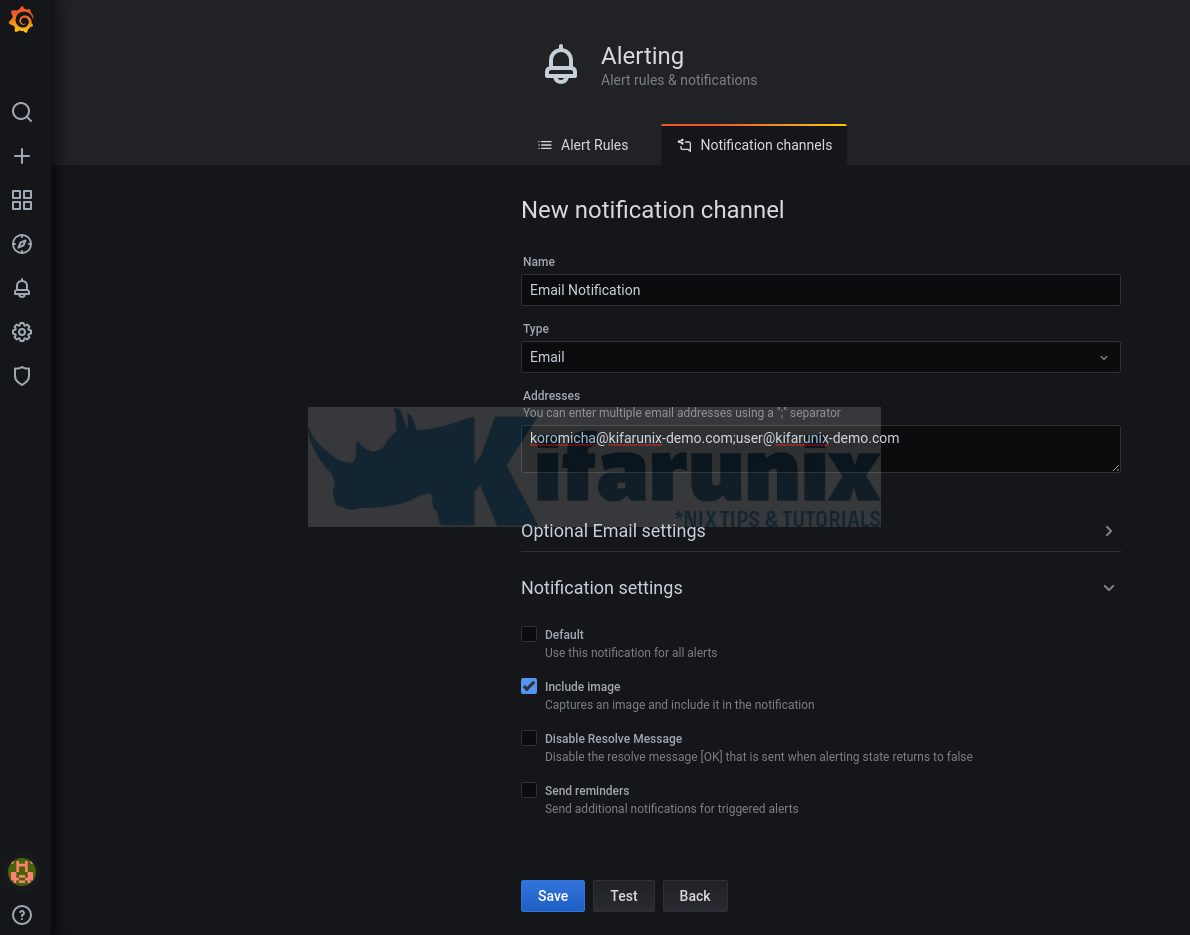
Once you have configured your channel settings, click Test to verify email deliverability.
If all is fine, you should get Test notification sent.
Also, you should receive Test notification email on your recipient inbox.
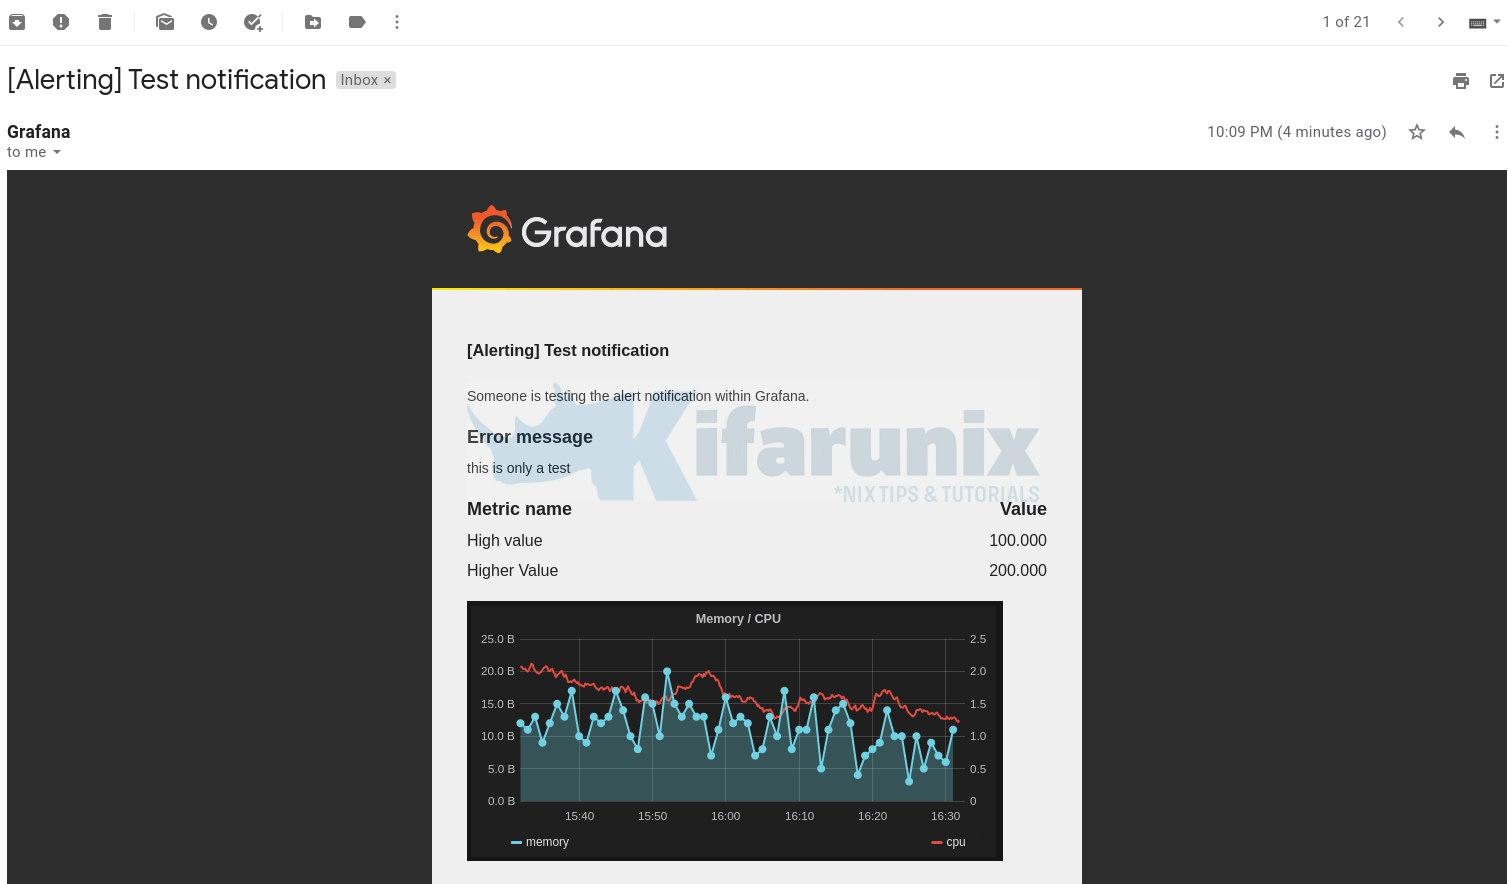
If not, check Grafana logs;
tail -f /var/log/grafana/grafana.logSave the Channel, when done testing.
Click on the title of the graph panel that you want to configure alerts for and click Edit. For example in our case, we have a graph for CPU load average.
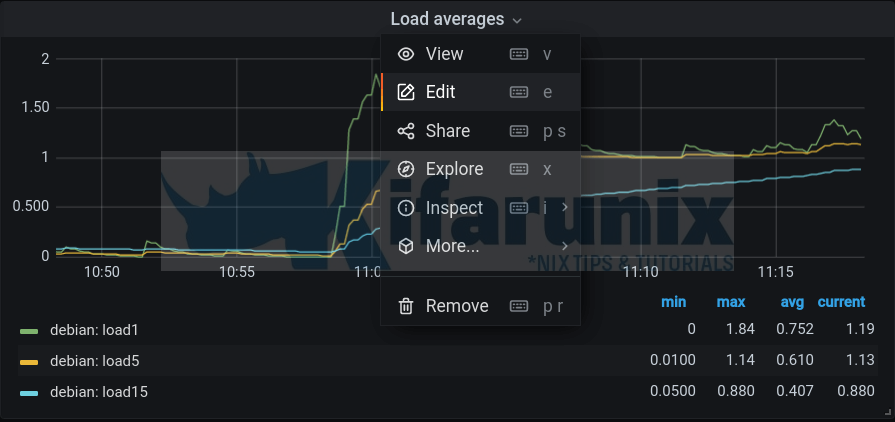
When the panel is opened for editing, click on the Alert tab.
Next, click Create Alert to setup your alerting;
- Set the rule name and frequency for evaluation of your threshold before an alert is sent out (we set it to evaluate a threshold for 1 min every 1 mins for easy demo).

- Set the rule conditions based on the number of queries your graph panel have. So we have three queries and hence three conditions of each Query.
The queries

The Conditions:

When you set the conditions, an icon shown in the screenshot below is set on the graph panel;

- No data and error handling settings

- Choose the Notification channel created earlier by clicking Send to.
- Set the notification message body. You can create your custom message as you see fit;

Save the dashboard when done setting the alert rule and conditions and notifications.
Test the alerting by clicking on Test rule.
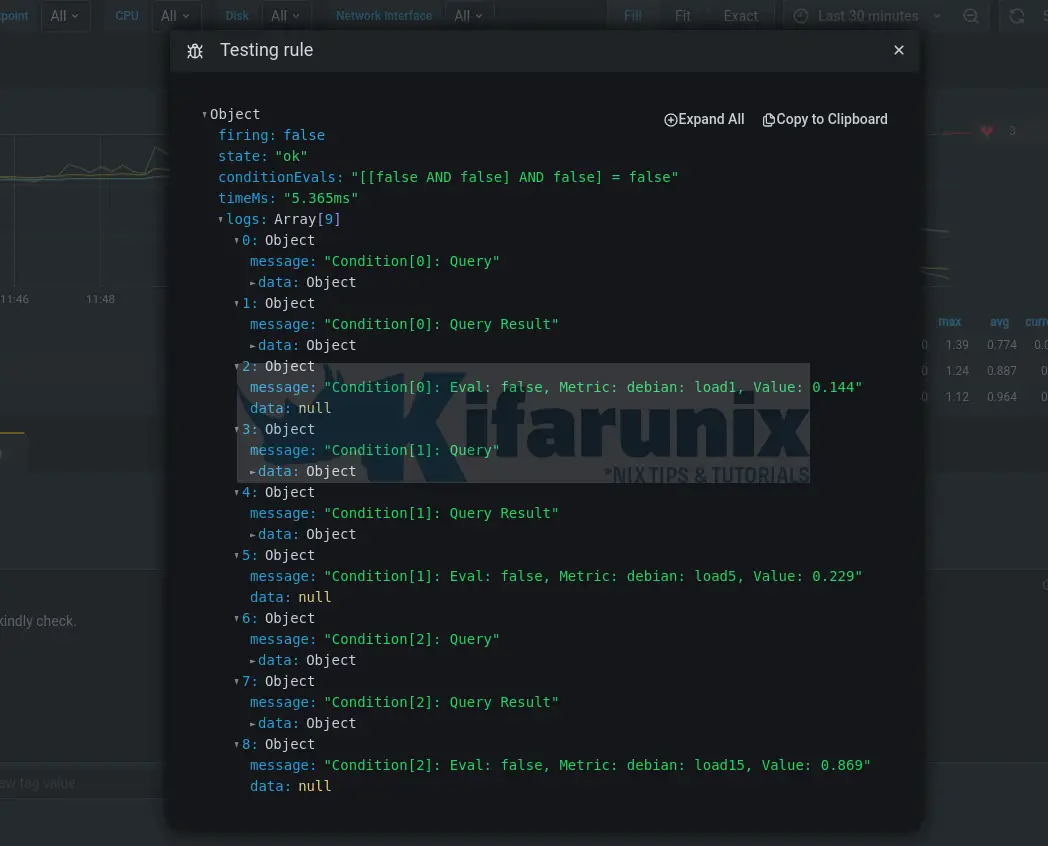
Now your graph panel shows like as below with all the values of the last 1,5,15 mins load average within the range. With green line showing the threshold is fine.
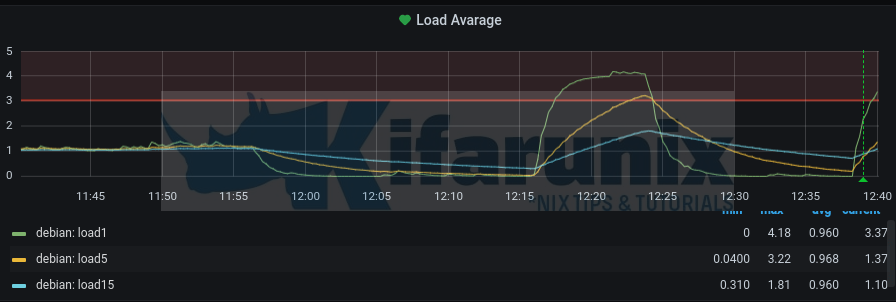
Now, we need to simulate the CPU usage by running the command below;
run the command below like four times on the terminal;
i=1; while [ $i -le 4 ]; do yes > /dev/null & ((i++)); doneWatch the CPU hike using htop/top or w commands as you view your grafana graph.
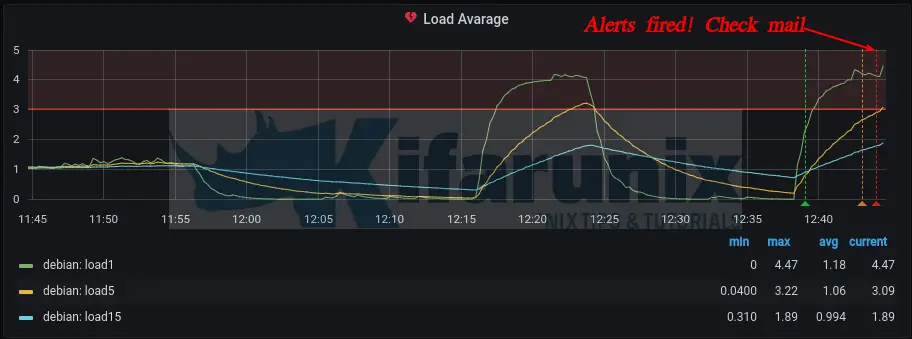
Once you see the red line, that is when the alert if fired.
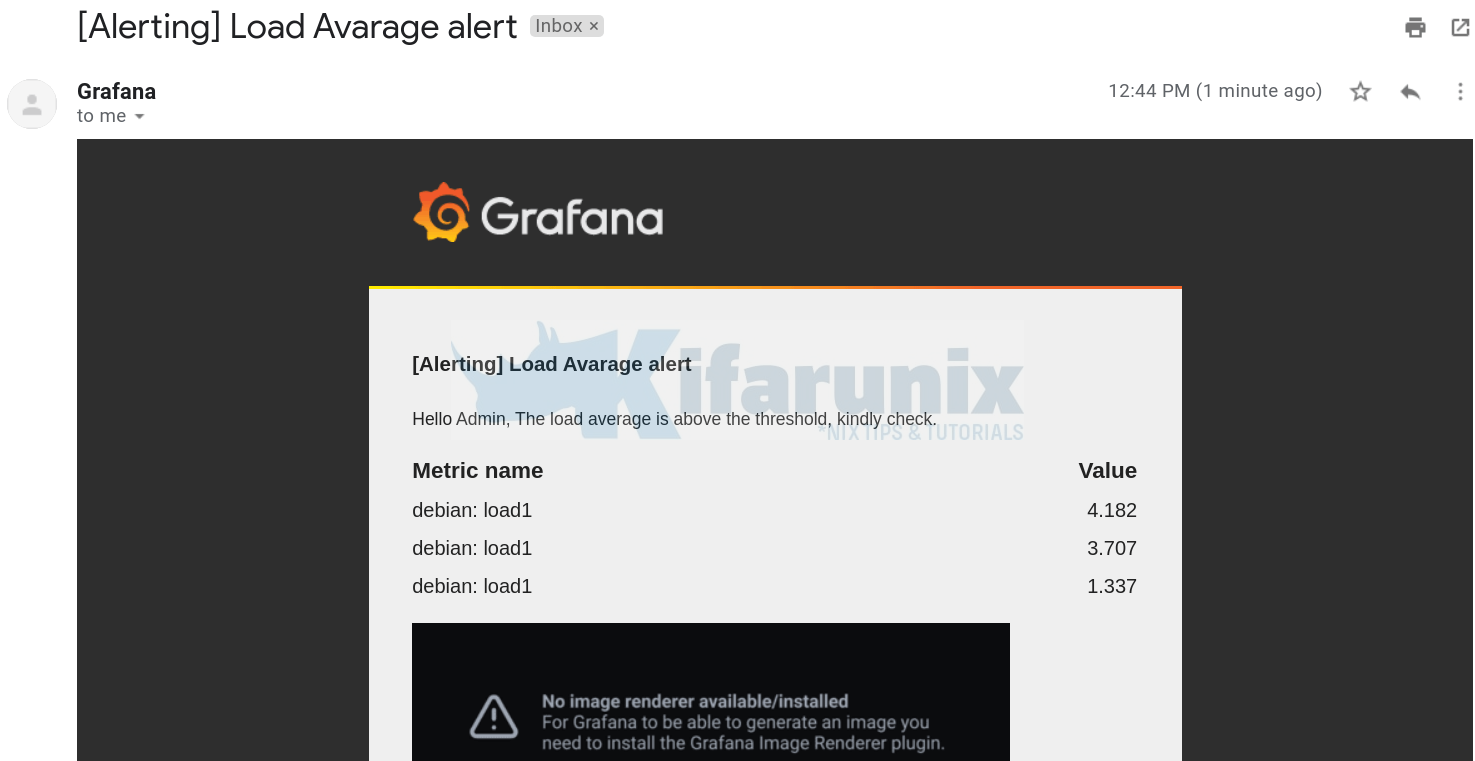
The mail alert notification;
And there you go.
Other Tutorials;
Configure ELK Stack Alerting with ElastAlert
Monitor SSL/TLS Certificate Expiry with Prometheus and Grafana

