This guide will take you through how to integrate Prometheus with Grafana for Monitoring. As much as Prometheus can give you some excellent visualization graphs, Grafana is the best, easy to use metrics analytics and visualization tool.
In our previous guides, we have covered;
Install Prometheus on Ubuntu 18.04
Monitor Linux System Metrics with Prometheus Node Exporter
Integrate Prometheus with Grafana for Monitoring
Once you have setup Prometheus and have it scrape the metrics from different end points, you may want to integrate with Grafana for the most beautiful visualization dashboards.
You can install Grafana on Fedora/Ubuntu/Debian servers by following the links below;
Install Grafana 6.2.x on Ubuntu 18.04/Debian 9
Install Grafana Monitoring Tool on Fedora 29
Install Grafana Metrics Monitoring Tool on Debian 9
Add Grafana Prometheus Data Source
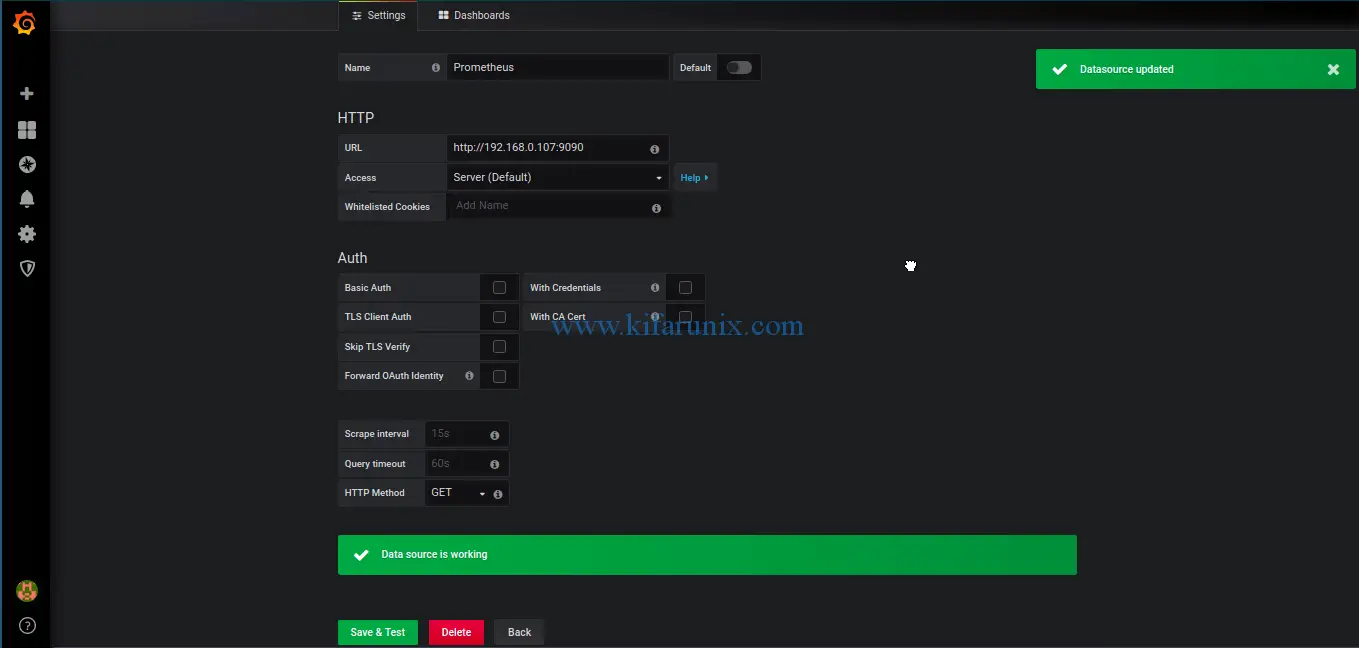
Once your Grafana and Prometheus servers are up and running, login to your Grafana and add the Prometheus data source by navigating to Configuration > Datasources > Add data source.
From the data source types, select Prometheus. This opens up Prometheus datasource configuration page.
Enter the Prometheus server URL. If you are running Grafana and Prometheus on the same server, use the address http://localhost:9090 otherwise, use the address http://<prometheus-server-IP>:9090.
After that, click Save & Test.

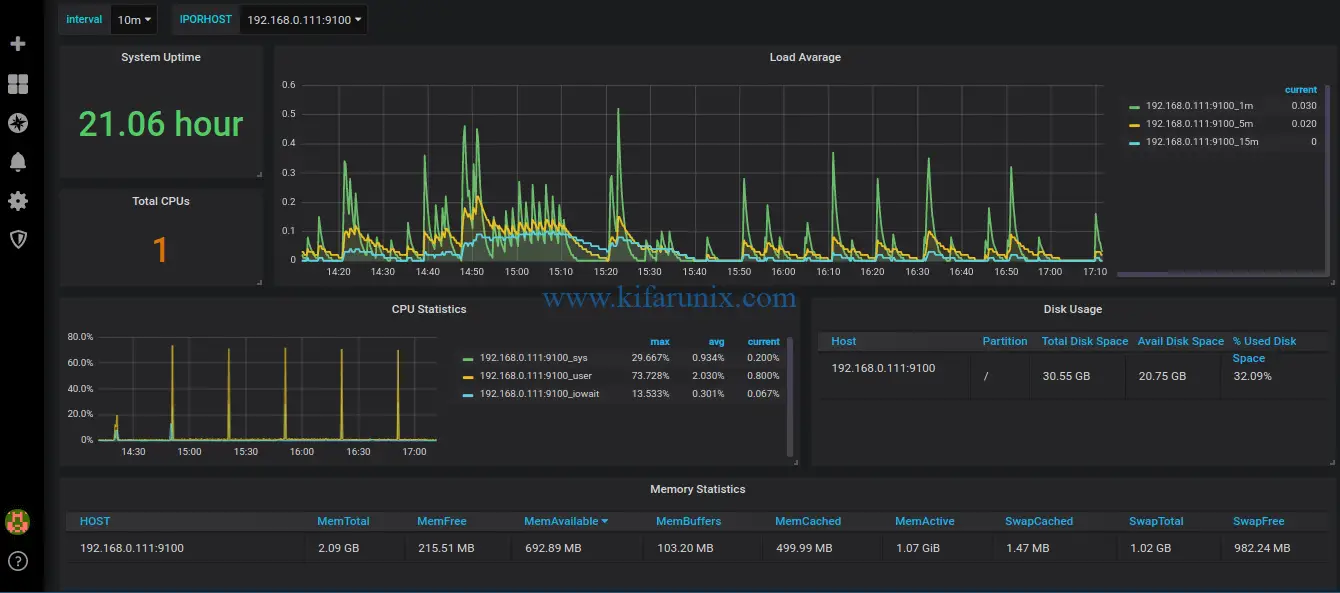
Next, you can now create your own dashboards for data visualization or import any that has been created by the community from the Grafana Dashboards. For example, the dashboard, Grafana-Prometheus-Node_Exporter_Host_Metrics_Dashboard, has been imported and used in this demo and used to display the metrics collected using the Prometheus Node Exporter. The dashboard looks like in below;


Well, that is all on how to integrate Prometheus with Grafana for Monitoring. Feel free to improve the dashboards above, or just create one that suits your needs. Enjoy.
Other Tutorials;
Integrate Prometheus with Grafana for Monitoring
Monitor Linux System Metrics with Prometheus Node Exporter


Great article !