Measuring the resolution of Fuji X-T2
Here is a small experiment to measure the resolution limit of Fuji X-T2. In photography, usually the MTF charts of the lenses are published assuming (I guess) the sensor is not the limiting factor. However, for example in microscopy, the situation is different. The optical systems in microscopy have a very high resolution.
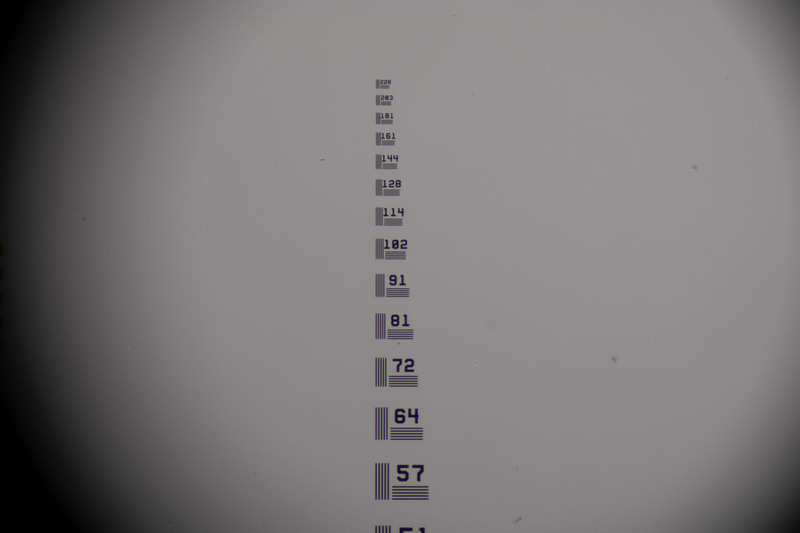
I made the measurements using a Zeiss Stemi 508 Stereo Microscope (max. magnification 5X, no additional front-optics) with Thorlabs high-frequency NBS 1963A resolution test target, which has a maximum frequency of 228 lp/mm. Fuji X-T2 is connected to the phototube of the microscope without any optical adapter, so the sensor is directly seeing the phototube.
Stemi 508 (at 5X) has a maximum resolution of 225 lp/mm. Fuji X-T2 has a pixel pitch of 3.9um, so its nyquist limit is 1000/2*3.93um = 127 lp/mm. So I believe the optical system, the microscope, is not the limiting factor for the measurements.
I have simply taken a few photographs like below at 5X magnification.

and then calculated the contrast ratio of a few targets. For the contrast ratio, I tried to find the minimum and maximum L values (in Lab color space in Adobe Photoshop) in white and black lines, and then simply used contrast ratio = (Lmax - Lmin) / (Lmax + Lmin).
Here is the result:
| Frequency | Contrast Ratio |
|---|---|
| 91 lp/mm | 43% |
| 114 lp/mm | 40% |
| 144 lp/mm | 24% |
| 181 lp/mm | 13% |
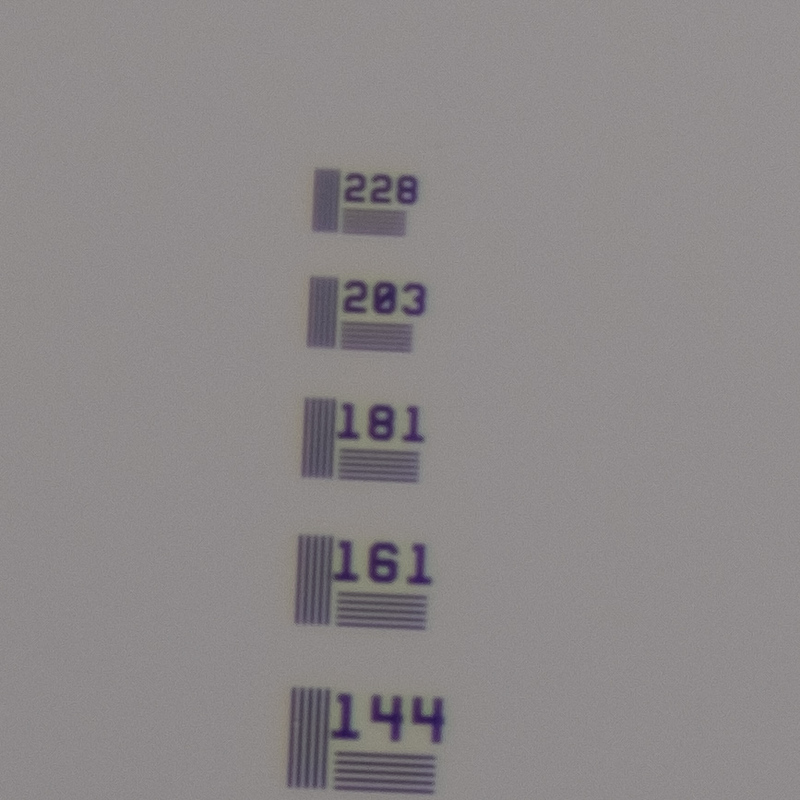
Although the nyquist limit of resolution of the sensor is around 127 lp/mm, this is I believe a bit incorrect because it might be higher due to use of some image processing methods. Looking at the table, and the images, I can say above 20% contrast ratio, they look OK, but after that it is becoming very difficult to distinguish the lines. You can see the 181 lp/mm close-up below.

This work is licensed under a Creative Commons Attribution-NonCommercial-ShareAlike 4.0 International License.