How can I install Filebeat 8 on Debian 12? Well, the installation of Filebeat 8 on Debian 12 is no different from the rest of the versions installation. The only change with Filebeat 8 is that it will require some kind of authentication to be able to connect to Elasticsearch, that is if you are sending logs directly to Elasticsearch 8.
Table of Contents
Installing Filebeat 8 on Debian 12
To collect logs from Debian 12 for monitoring using ELK stack, you need to install Filebeat.
Filebeat 8 can be installed on Debian 12 as follows;
Prerequisites
To process and visualize logs collected from Debian 12 using Filebeat, then install Elastic Stack.
Install ELK Stack 8 on Debian 12
Install Elastic Repos on Debian 12
To install Filebeat 8, you need to install Elastic 8.x repositories.
Install Elastic stack 8 repository signing key.
apt install sudo gnupg2 apt-transport-https curl vim -ywget -qO - https://artifacts.elastic.co/GPG-KEY-elasticsearch | \
gpg --dearmor > /etc/apt/trusted.gpg.d/elk.gpgInstall the Elastic Stack 8 repository;
echo "deb https://artifacts.elastic.co/packages/8.x/apt stable main" \
> /etc/apt/sources.list.d/elastic-8.list
Run system update;
apt updateInstalling Filebeat 8 on Debian 12
You can now install Filebeat 8 using the command below;
apt install filebeatConfigure Filebeat 8
Filebeat Default Configs
/etc/filebeat/filebeat.yml is the default Filebeat configuration file.
Below are the default configs of Filebeat;
cat /etc/filebeat/filebeat.ymlThe file is fully commented.
###################### Filebeat Configuration Example #########################

# This file is an example configuration file highlighting only the most common
# options. The filebeat.reference.yml file from the same directory contains all the
# supported options with more comments. You can use it as a reference.
#
# You can find the full configuration reference here:
# https://www.elastic.co/guide/en/beats/filebeat/index.html

# For more available modules and options, please see the filebeat.reference.yml sample
# configuration file.

# ============================== Filebeat inputs ===============================

filebeat.inputs:

# Each - is an input. Most options can be set at the input level, so
# you can use different inputs for various configurations.
# Below are the input specific configurations.

# filestream is an input for collecting log messages from files.
- type: filestream

  # Unique ID among all inputs, an ID is required.
  id: my-filestream-id

  # Change to true to enable this input configuration.
  enabled: false

  # Paths that should be crawled and fetched. Glob based paths.
  paths:
    - /var/log/*.log
    #- c:\programdata\elasticsearch\logs\*

  # Exclude lines. A list of regular expressions to match. It drops the lines that are
  # matching any regular expression from the list.
  # Line filtering happens after the parsers pipeline. If you would like to filter lines
  # before parsers, use include_message parser.
  #exclude_lines: ['^DBG']

  # Include lines. A list of regular expressions to match. It exports the lines that are
  # matching any regular expression from the list.
  # Line filtering happens after the parsers pipeline. If you would like to filter lines
  # before parsers, use include_message parser.
  #include_lines: ['^ERR', '^WARN']

  # Exclude files. A list of regular expressions to match. Filebeat drops the files that
  # are matching any regular expression from the list. By default, no files are dropped.
  #prospector.scanner.exclude_files: ['.gz$']

  # Optional additional fields. These fields can be freely picked
  # to add additional information to the crawled log files for filtering
  #fields:
  #  level: debug
  #  review: 1

# ============================== Filebeat modules ==============================

filebeat.config.modules:
  # Glob pattern for configuration loading
  path: ${path.config}/modules.d/*.yml

  # Set to true to enable config reloading
  reload.enabled: false

  # Period on which files under path should be checked for changes
  #reload.period: 10s

# ======================= Elasticsearch template setting =======================

setup.template.settings:
  index.number_of_shards: 1
  #index.codec: best_compression
  #_source.enabled: false


# ================================== General ===================================

# The name of the shipper that publishes the network data. It can be used to group
# all the transactions sent by a single shipper in the web interface.
#name:

# The tags of the shipper are included in their own field with each
# transaction published.
#tags: ["service-X", "web-tier"]

# Optional fields that you can specify to add additional information to the
# output.
#fields:
#  env: staging

# ================================= Dashboards =================================
# These settings control loading the sample dashboards to the Kibana index. Loading
# the dashboards is disabled by default and can be enabled either by setting the
# options here or by using the `setup` command.
#setup.dashboards.enabled: false

# The URL from where to download the dashboards archive. By default this URL
# has a value which is computed based on the Beat name and version. For released
# versions, this URL points to the dashboard archive on the artifacts.elastic.co
# website.
#setup.dashboards.url:

# =================================== Kibana ===================================

# Starting with Beats version 6.0.0, the dashboards are loaded via the Kibana API.
# This requires a Kibana endpoint configuration.
setup.kibana:

  # Kibana Host
  # Scheme and port can be left out and will be set to the default (http and 5601)
  # In case you specify and additional path, the scheme is required: http://localhost:5601/path
  # IPv6 addresses should always be defined as: https://[2001:db8::1]:5601
  #host: "localhost:5601"

  # Kibana Space ID
  # ID of the Kibana Space into which the dashboards should be loaded. By default,
  # the Default Space will be used.
  #space.id:

# =============================== Elastic Cloud ================================

# These settings simplify using Filebeat with the Elastic Cloud (https://cloud.elastic.co/).

# The cloud.id setting overwrites the `output.elasticsearch.hosts` and
# `setup.kibana.host` options.
# You can find the `cloud.id` in the Elastic Cloud web UI.
#cloud.id:

# The cloud.auth setting overwrites the `output.elasticsearch.username` and
# `output.elasticsearch.password` settings. The format is `:`.
#cloud.auth:

# ================================== Outputs ===================================

# Configure what output to use when sending the data collected by the beat.

# ---------------------------- Elasticsearch Output ----------------------------
output.elasticsearch:
  # Array of hosts to connect to.
  hosts: ["localhost:9200"]

  # Protocol - either `http` (default) or `https`.
  #protocol: "https"

  # Authentication credentials - either API key or username/password.
  #api_key: "id:api_key"
  #username: "elastic"
  #password: "changeme"

# ------------------------------ Logstash Output -------------------------------
#output.logstash:
  # The Logstash hosts
  #hosts: ["localhost:5044"]

  # Optional SSL. By default is off.
  # List of root certificates for HTTPS server verifications
  #ssl.certificate_authorities: ["/etc/pki/root/ca.pem"]

  # Certificate for SSL client authentication
  #ssl.certificate: "/etc/pki/client/cert.pem"

  # Client Certificate Key
  #ssl.key: "/etc/pki/client/cert.key"

# ================================= Processors =================================
processors:
  - add_host_metadata:
      when.not.contains.tags: forwarded
  - add_cloud_metadata: ~
  - add_docker_metadata: ~
  - add_kubernetes_metadata: ~

# ================================== Logging ===================================

# Sets log level. The default log level is info.
# Available log levels are: error, warning, info, debug
#logging.level: debug

# At debug level, you can selectively enable logging only for some components.
# To enable all selectors use ["*"]. Examples of other selectors are "beat",
# "publisher", "service".
#logging.selectors: ["*"]

# ============================= X-Pack Monitoring ==============================
# Filebeat can export internal metrics to a central Elasticsearch monitoring
# cluster.  This requires xpack monitoring to be enabled in Elasticsearch.  The
# reporting is disabled by default.

# Set to true to enable the monitoring reporter.
#monitoring.enabled: false

# Sets the UUID of the Elasticsearch cluster under which monitoring data for this
# Filebeat instance will appear in the Stack Monitoring UI. If output.elasticsearch
# is enabled, the UUID is derived from the Elasticsearch cluster referenced by output.elasticsearch.
#monitoring.cluster_uuid:

# Uncomment to send the metrics to Elasticsearch. Most settings from the
# Elasticsearch output are accepted here as well.
# Note that the settings should point to your Elasticsearch *monitoring* cluster.
# Any setting that is not set is automatically inherited from the Elasticsearch
# output configuration, so if you have the Elasticsearch output configured such
# that it is pointing to your Elasticsearch monitoring cluster, you can simply
# uncomment the following line.
#monitoring.elasticsearch:

# ============================== Instrumentation ===============================

# Instrumentation support for the filebeat.
#instrumentation:
    # Set to true to enable instrumentation of filebeat.
    #enabled: false

    # Environment in which filebeat is running on (eg: staging, production, etc.)
    #environment: ""

    # APM Server hosts to report instrumentation results to.
    #hosts:
    #  - http://localhost:8200

    # API Key for the APM Server(s).
    # If api_key is set then secret_token will be ignored.
    #api_key:

    # Secret token for the APM Server(s).
    #secret_token:


# ================================= Migration ==================================

# This allows to enable 6.7 migration aliases
#migration.6_to_7.enabled: true
If you want to customize your Filebeat configurations, then update the configs above.
Configure Filebeat Logging
To ensure Filebeat writes logs to its own log file, enter the configs below in the configuration file;
cat >> /etc/filebeat/filebeat.yml << 'EOL'
logging.level: info
logging.to_files: true
logging.files:
  path: /var/log/filebeat
  name: filebeat
  keepfiles: 7
  permissions: 0640
EOL
Connect Filebeat to Data Processors
To begin with, configure Filebeat to connect to the data processors. This can be Logstash or Elasticsearch.
In this guide, we will be sending logs directly to Elasticsearch. Thus, edit the Filebeat configuration file and update the output.
Remember, Elasticsearch 8 requires SSL and Authentication to connect to.
Thus, confirm that you can connect to Elasticsearch port 9200/tcp. You can use telnet or any command that works for you;
telnet elk.kifarunix-demo.com 9200Trying 192.168.57.66...
Connected to elk.kifarunix-demo.com.
Escape character is '^]'.Download Elasticsearch CA certificate and store it in some directory (we save it as /etc/filebeat/elastic-ca.crt );
openssl s_client -connect elk.kifarunix-demo.com:9200 \
-showcerts </dev/null 2>/dev/null | \
openssl x509 -outform PEM > /etc/filebeat/elastic-ca.crtObtain the credentials that Filebeat can use to authenticate to Elasticsearch to write data to the indices. We use our default superadmin, elastic user, credentials here. I don’t recommend this though. Better create custom users with specific roles to write to specific indices.
Once you have that, edit the Filebeat and update the output section accordingly!
Default settings;
# ---------------------------- Elasticsearch Output ----------------------------
output.elasticsearch:
# Array of hosts to connect to.
hosts: ["localhost:9200"]
# Protocol - either `http` (default) or `https`.
#protocol: "https"
# Authentication credentials - either API key or username/password.
#api_key: "id:api_key"
#username: "elastic"
#password: "changeme"
After the changes;
# ---------------------------- Elasticsearch Output ----------------------------
output.elasticsearch:
# Array of hosts to connect to.
hosts: ["elk.kifarunix-demo.com:9200"]
# Protocol - either `http` (default) or `https`.
protocol: "https"
ssl.certificate_authorities: ["/etc/filebeat/elastic-ca.crt"]
# Authentication credentials - either API key or username/password.
#api_key: "id:api_key"
username: "elastic"
password: "changeme"
Save and exit the file.
Test the configuration file for any errors;
filebeat test configThe output of the command should be Config OK. Otherwise, fix any error.
Next, test the Filebeat output connection;
filebeat test outputIf all is good, you should get such an output;
elasticsearch: https://elk.kifarunix-demo.com:9200...
parse url... OK
connection...
parse host... OK
dns lookup... OK
addresses: 192.168.57.66
dial up... OK
TLS...
security: server's certificate chain verification is enabled
handshake... OK
TLS version: TLSv1.3
dial up... OK
talk to server... OK
version: 8.8.1
Configure Filebeat to Collect Log Data from Traditional Syslog Files
There are different methods in which Filebeat can be configured to collect system logs;
- Manual configuration via Filebeat inputs. The
filestreaminput is the default input for Filebeat, though it is disabled by default. - Via Filebeat modules which provide a quick way to get started processing common log formats. They contain default configurations, Elasticsearch ingest pipeline definitions, and Kibana dashboards to help you implement and deploy a log monitoring solution.
- Using ECS loggers,
For the purposes of this demonstration guide, we will configure our Filebeat to collect data using Filebeat modules.
There are different modules supported by Filebeat. You can get a list of all these modules using the command below;
filebeat modules listNo module is enabled by default.
To enable a specific module, use the command below replacing MODULE_NAME with the respective module;
filebeat modules enable MODULE_NAMEFor example, to enable system module;
filebeat modules enable systemThe system module collects and parses logs created by the system logging service of common Unix/Linux based distributions.
The modules configurations are stored under /etc/filebeat/modules.d/. All disabled modules have the suffix .disabled on their configuration files. When you enable a module, this suffix is removed.
The default configuration of system module;
cat /etc/filebeat/modules.d/system.yml
# Module: system
# Docs: https://www.elastic.co/guide/en/beats/filebeat/8.8/filebeat-module-system.html
- module: system
# Syslog
syslog:
enabled: false
# Set custom paths for the log files. If left empty,
# Filebeat will choose the paths depending on your OS.
#var.paths:
# Authorization logs
auth:
enabled: false
# Set custom paths for the log files. If left empty,
# Filebeat will choose the paths depending on your OS.
#var.paths:
As you can see from the above, as much as the module is enabled, the filesets (type of log data that Filebeat can harvest) are disabled.
Hence, run the command below to enable;
sed -i '/enabled:/s/false/true/' /etc/filebeat/modules.d/system.ymlIf you want to collect additional logs, uncomment the var.paths config and defile the paths of the logs to collect. For example, your var.paths would look like;
var.paths: ["/path/to/log1","/path/to/log2","/path/to/logN" ]For now, we will use the default configs!
Save and exit the file.
Test the config;
filebeat test configOutput of the command should be Config OK.
Load Filebeat Index Template and Sample Dashboards
Filebeat ships with index templates for writing data into Elasticsearch. It also ships with sample dashboards for visualizing the data.
If you are sending log data directly to Elasticsearch, then Filebeat will load the index mapping template into Elasticsearch automatically.
However, it doesn’t load the dashboards automatically. You can load the Filebeat visualization dashboards into Kibana as by running the command below;
To load the dashboards, there has to be a direct connection to Kibana. You can confirm that you can connect to Kibana port, 5601, as follows;
telnet elk.kifarunix-demo.com 5601
Trying 192.168.57.66...
Connected to elk.kifarunix-demo.com.
Escape character is '^]'.
If the connection is okay, then execute the command below to load the dashboards;
filebeat setup --dashboards -E setup.kibana.host='http://elk.kifarunix-demo.com:5601'Sample output;
Loading dashboards (Kibana must be running and reachable)
Loaded dashboards
If you are using Logstash as the Filebeat output, then load the index and dashboards as follows;
Load Index template and Kibana dashboards when Logstash output is enabled
Update the command accordingly, if Elasticsearch is using SSL and requires authentication, then you can use something like;
filebeat setup --index-management \
-E output.logstash.enabled=false \
-E output.elasticsearch.hosts=["https://ES_FQDN:9200"] \
-E output.elasticsearch.username="your_username" \
-E output.elasticsearch.password="your_password" \
-E output.elasticsearch.ssl.certificate_authorities=["/path/to/ca.crt"] \
-E setup.kibana.host=KIBANA_ADDRESS:5601
Configure Filebeat to Collect Log Data from Journald
Journald is the default logging system on Debian 12. As such, you may have realized that traditional syslogs and authentication logs are written to journld instead of syslog.
From command line, you can always read these logs using journalctl command.
But, if you are using Filebeat, how can you be able to read such logs and send them to ELK stack for processing and visualization?
With this, there is currently no Filebeat module that can be used to read journald logs. However, Filebeat supports Journald Input that can be used to read journald log data and metadata.
So, on Debian 12, you can configure Filebeat to read journald logs as follows;
Open the filebeat configuration file for editing;
vim /etc/filebeat/filebeat.ymlUpdate the Inputs section and add the following configs to read log data from the default journal.
filebeat.inputs:
...
- type: journald
Journald input supports various filtering to allow you drop some logs that you may not require and only collect those that you deem necessary for collection and visualization.
Save the file and exit.
Test the config;
filebeat test configEnsure the output is Config OK.
NOTE that modules dashboards doesnt apply to Journld logs data.
If you want, you can disable Journald logging and enable the traditional syslog logging via Rsyslog;
Enable Rsyslog Logging on Debian 12
Some of the Dashboards, such as system event data related dashboards that you loaded on Kibana using Filebeat, will require the logs from Rsyslog to visualize!
Running Filebeat
You should be good to start Filebeat on your system now.
Before you can start Filebeat service, it is good to run it on foreground and log to stderr and disable syslog/file output using the command below so that in case there is an error, then you can spot and fix immediately.
filebeat -eWhen you run, ensure that you see a line that say connection established.
Connection to backoff(elasticsearch(https://elk.kifarunix-demo.com:9200)) established"Hence, start and enable it to run on system boot;
systemctl enable --now filebeatViewing Filebeat Data on Kibana
If everything is okay, Filebeat will now collect system data and push them Elasticsearch, and can be visualized on Kibana.
Filebeat Elasicsearch Indices/Data Streams
Elasticsearch 8 now uses data streams to store log data. According to Documentation, “Data streams are well-suited for logs, events, metrics, and other continuously generated data.“
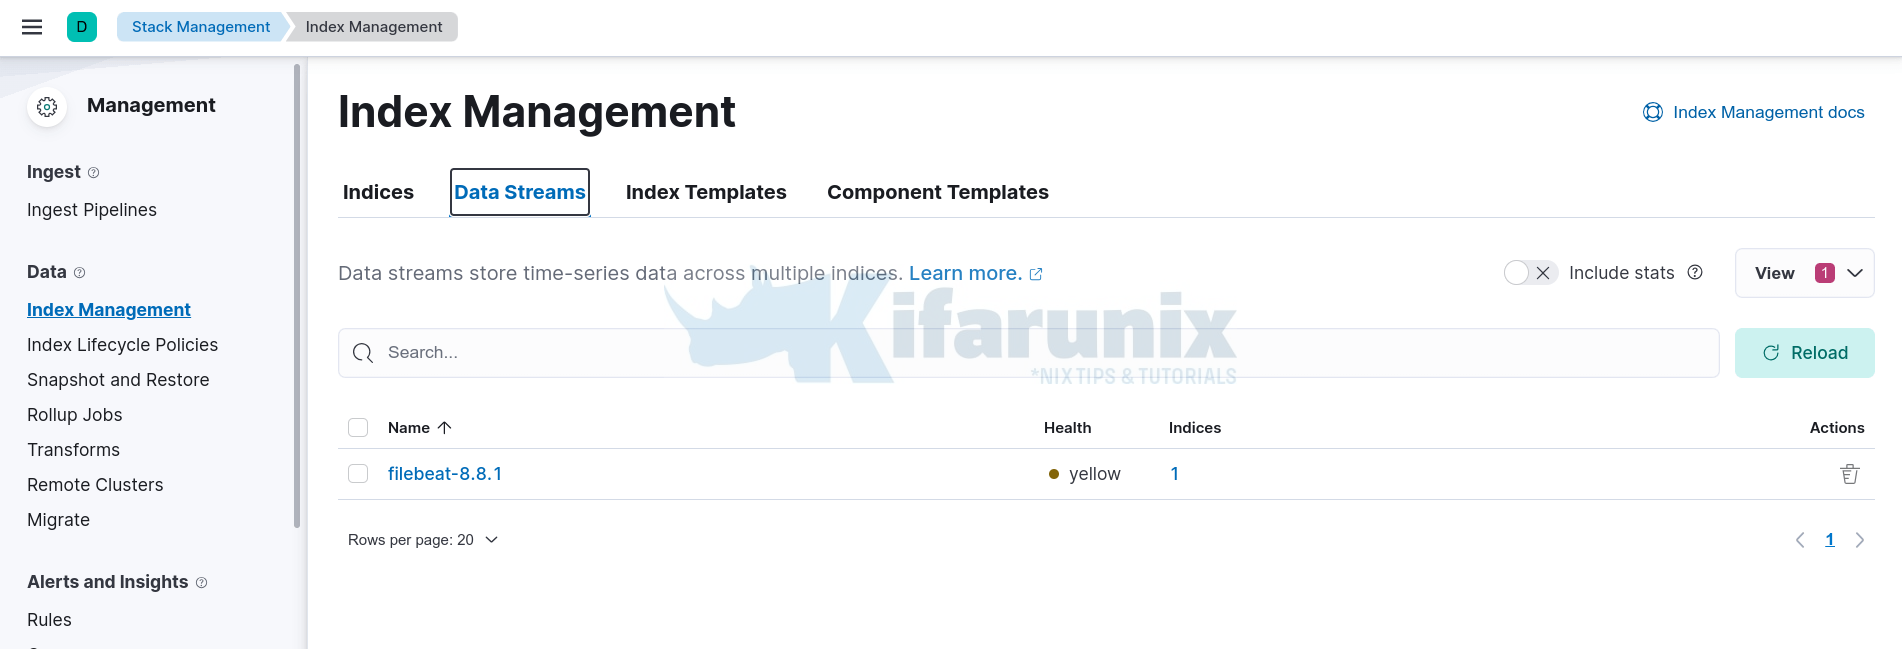
So, login to Kibana and navigate to Management > Stack Management > Data > Index Management > Data Streams.
If Filebeat has already started collecting your journal logs, then you should see the default Filebeat data stream;

Kibana Index Patterns
In order for you to view the logs stored on the data stream, you need to create Kibana index pattern that matches the specific data stream.
Thus, navigate to Management > Stack Management > Data > Kibana > Data Views.
If you had pushed your dashboards via filebeat setup --dashboards command, then you should already have a Filebeat index pattern created;

Otherwise, if not already created, then;
- Click Create data view
- Enter the name of the data view
- type an index pattern to match your data stream
- select timestamp field, (usually @timestamp)
- then Save data view to Kibana.
Viewing Logs on Kibana
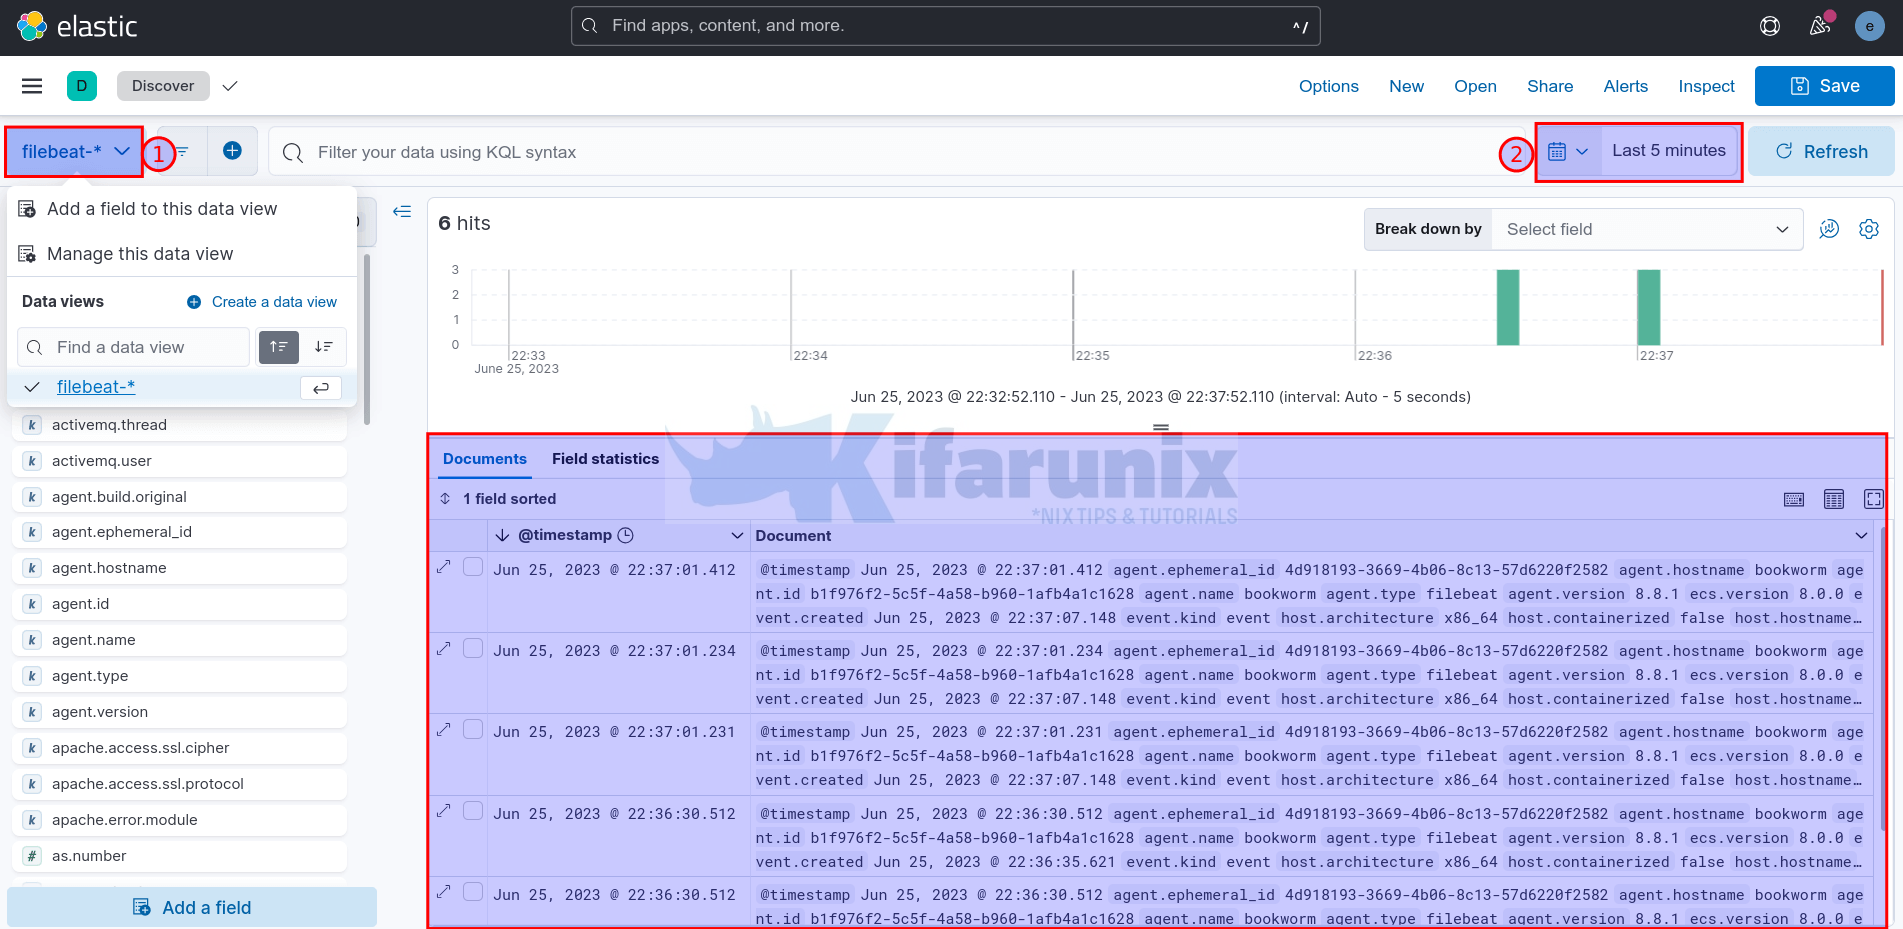
You should now be able to view the raw logs written to your data stream from Kibana > Analytics > Discover.
Select your data view/index pattern to view the logs.
Set the time range to view the data.

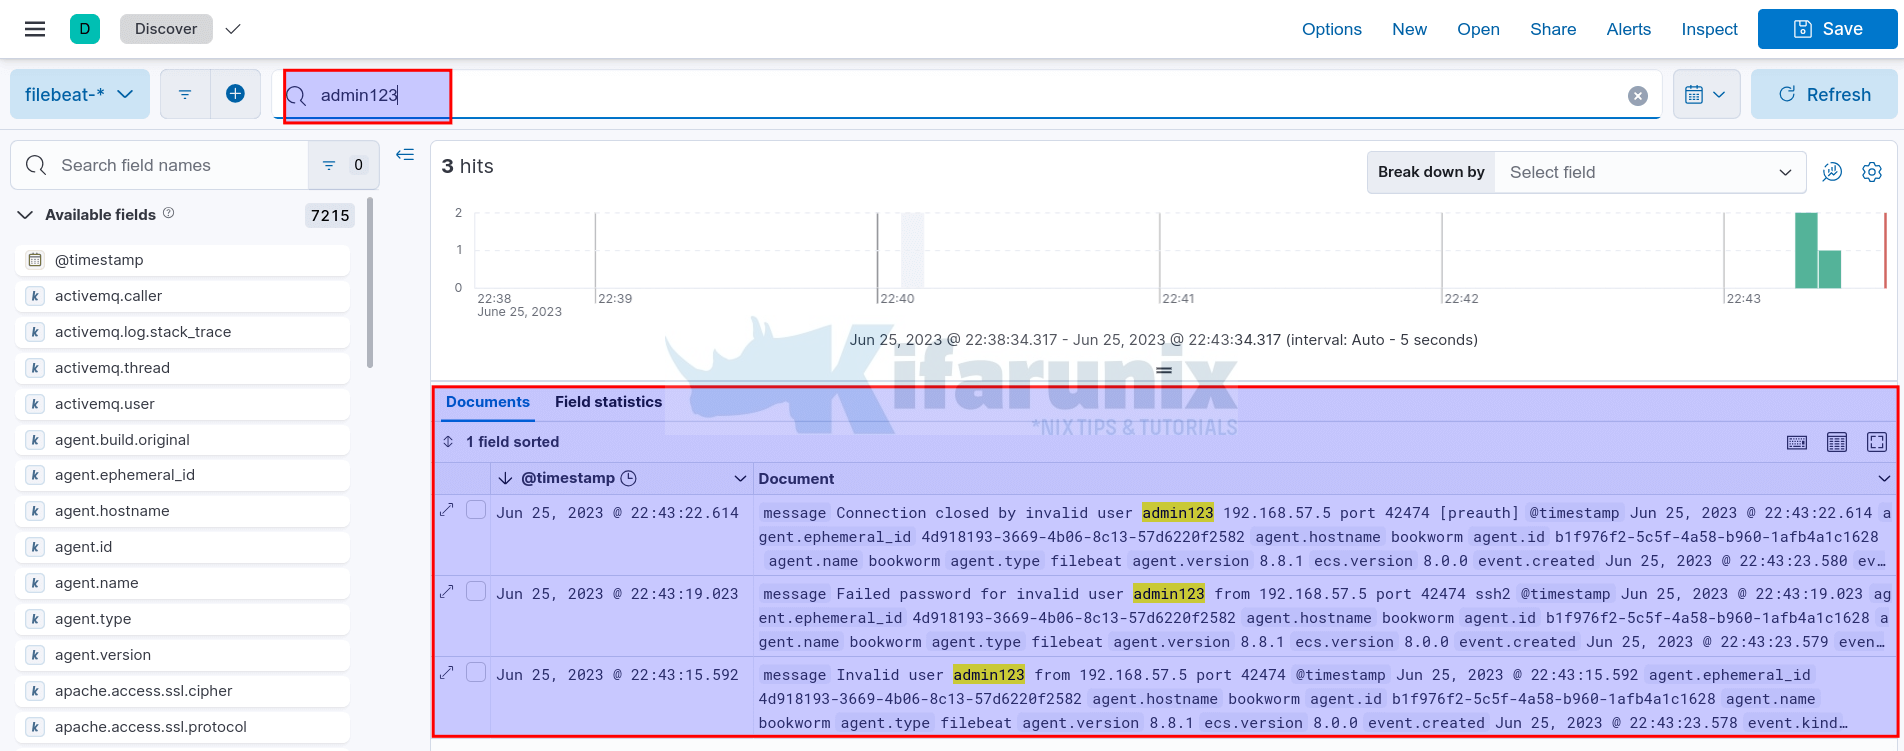
On the system filebeat is running, you can simulate some events such as failed authentications and try to search for these logs on Kibana.
For example, l attempted to SSH to debian 12 vm with invalid user admin123;

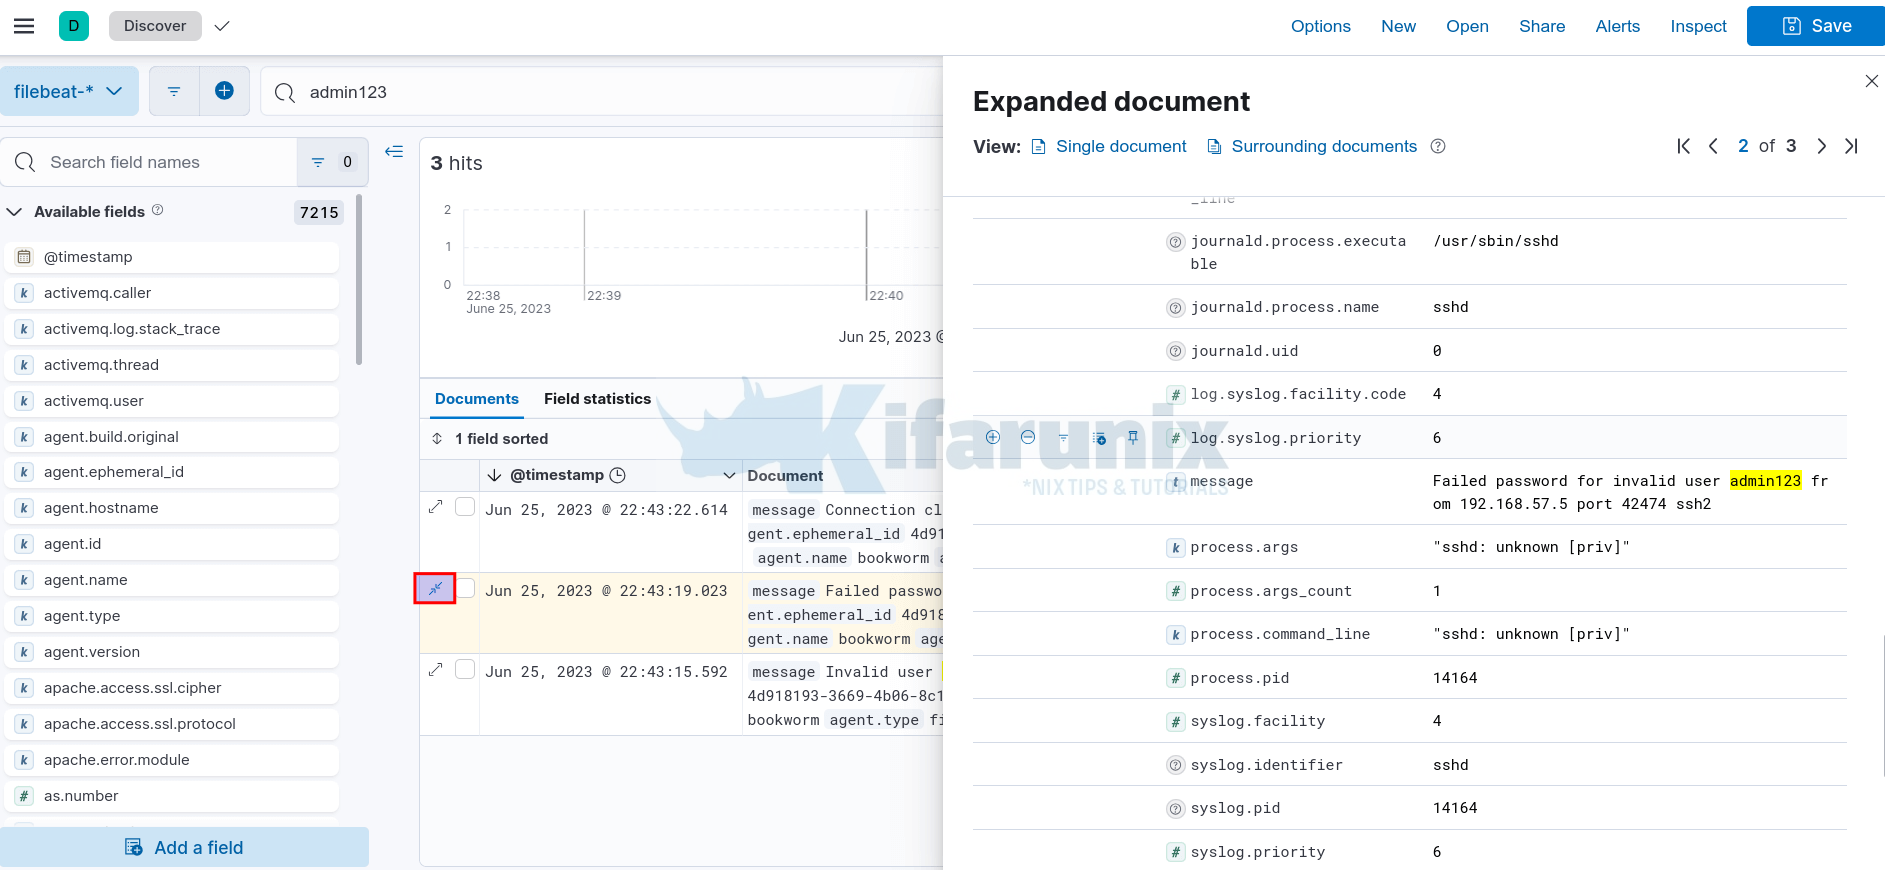
Expand one of the events;

If you enable Rsyslog logging, then your dashboards should also be working fine!
And that is it. That is all for now on installing Filebeat 8 on Debian 12.

